
FIGURE
Figure 3
- ID
- ZDB-FIG-210902-98
- Publication
- Li et al., 2021 - ExpressHeart: Web Portal to Visualize Transcriptome Profiles of Non-Cardiomyocyte Cells
- Other Figures
- All Figure Page
- Back to All Figure Page
Figure 3
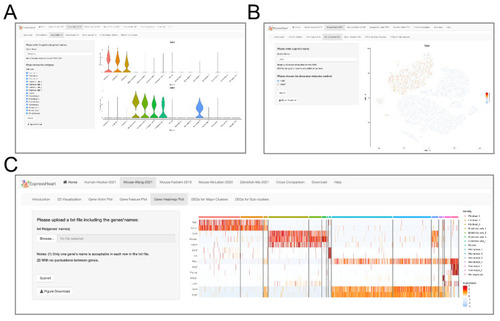
Interfaces of gene expression levels via (A) violin plot, (B) feature plot, and (C) heatmap. On the left panel of each interface, uses can specify a gene of interest for violin plot (A) or feature plot (B), or upload a text file containing a list of genes of interest for heatmap visualization (C). After clicking the “Submit” button, the corresponding violin/feature/heatmap plot for the target gene(s) will show on the right panel. |
Expression Data
Expression Detail
Antibody Labeling
Phenotype Data
Phenotype Detail
Acknowledgments
This image is the copyrighted work of the attributed author or publisher, and
ZFIN has permission only to display this image to its users.
Additional permissions should be obtained from the applicable author or publisher of the image.
Full text @ Int. J. Mol. Sci.