
FIGURE
Figure 6
- ID
- ZDB-FIG-210902-105
- Publication
- Li et al., 2021 - ExpressHeart: Web Portal to Visualize Transcriptome Profiles of Non-Cardiomyocyte Cells
- Other Figures
- All Figure Page
- Back to All Figure Page
Figure 6
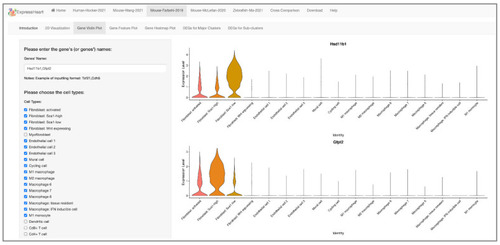
Comparison between two mice datasets. The two violin plots show the expression profiles of the feature genes of two fibroblast subtypes (Hsd11b1 and Gfpt2, respectively) in the Mouse-Wang-2021 dataset in the major subtypes identified in the Mouse-Farbehi-2019 dataset. Users can type in the name(s) of target gene(s) and choose the cell type(s) of interest by checking the corresponding box(es) on the left panel, and the violin plot(s) showing the gene expression level will be presented on the right. |
Expression Data
Expression Detail
Antibody Labeling
Phenotype Data
Phenotype Detail
Acknowledgments
This image is the copyrighted work of the attributed author or publisher, and
ZFIN has permission only to display this image to its users.
Additional permissions should be obtained from the applicable author or publisher of the image.
Full text @ Int. J. Mol. Sci.