
Image
|
Figure Caption
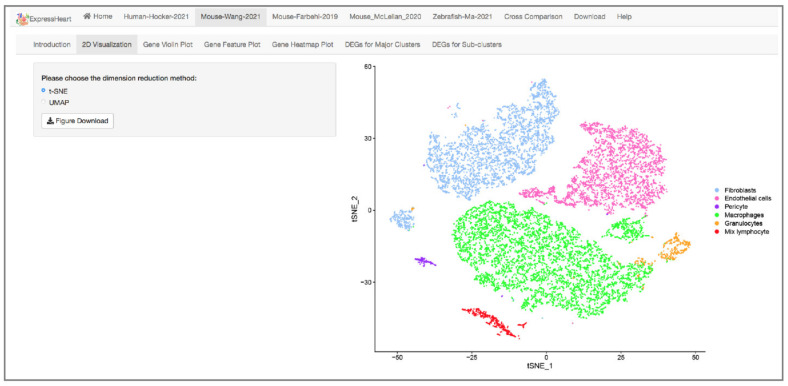
Figure 2
Interface of 2D visualization via UMAP/t-SNE for the Mouse-Wang-2021 dataset. On the left panel, users can choose different dimension reduction methods; the corresponding 2D UMAP/t-SNE plot is presented on the right. Each dot represents a cell/nucleus, and different colors correspond to different cell types.
Acknowledgments
This image is the copyrighted work of the attributed author or publisher, and
ZFIN has permission only to display this image to its users.
Additional permissions should be obtained from the applicable author or publisher of the image.
Full text @ Int. J. Mol. Sci.