
- Title
-
Zebrafish Motile Cilia as a Model for Primary Ciliary Dyskinesia
- Authors
- Pinto, A.L., Rasteiro, M., Bota, C., Pestana, S., Sampaio, P., Hogg, C., Burgoyne, T., Lopes, S.S.
- Source
- Full text @ Int. J. Mol. Sci.
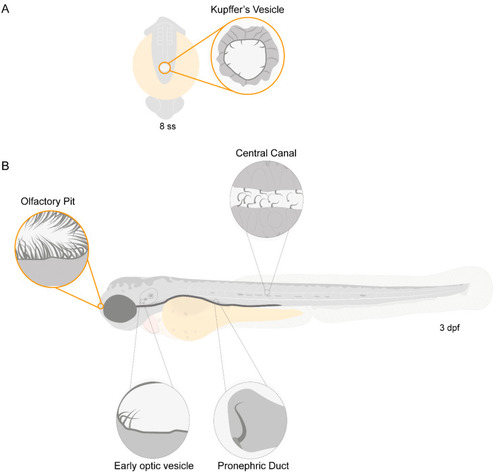
Motile ciliated structures in zebrafish. Schematic representation of (A), a zebrafish embryo at 8 somite stages (ss) highlighting Kupffer’s vesicle (KV); (B) a 3-day post-fertilization (dpf) zebrafish larva indicating structures with motile cilia. Olfactory pit (OP) and KV cilia analysed in the present study are circled in orange. |
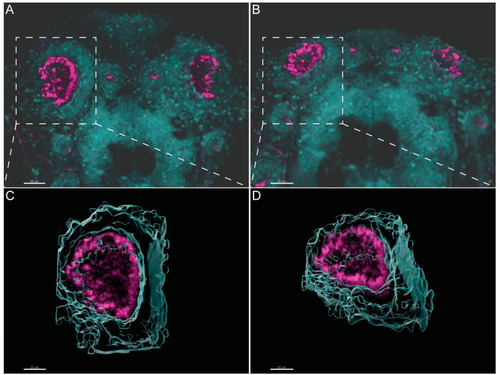
Three-dimensional imaging analysis helps to orient and localize the OP of zebrafish for TEM studies. (A,B). Immunofluorescent labelling with anti-acetylated α-tubulin shows the distribution of multiciliated cells in the OP of 4 dpf larvae. Software Imaris (Bitplane) v.9.5.0 allowed 3D blend reconstructions of 2 different OPs from 2 different larvae. (C,D) 3D surface reconstructions from the respective OPs revealing the concave morphology of the organ when rotated. Anti-Acetylated α-tubulin immunofluorescence in magenta and DAPI in cyan. Scale bar 20 μm. |
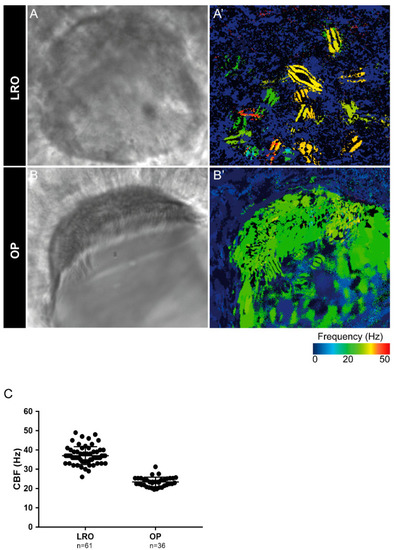
Cilia beat frequency (CBF) evaluation for zebrafish cilia. (A,A’) Full LRO heatmap showing several monocilia at one plane beating at different frequencies (20–50 Hz). (B,B’) OP heatmap showing multiciliated cells with cilia beating at more homogeneous frequencies (around 20 Hz). CBF was measured using the software CiliarMove [41] (C) Quantification of CBF from n = 61 LROs and n = 36 OPs from embryos at 10 ss and 4 dpf larvae, respectively. |
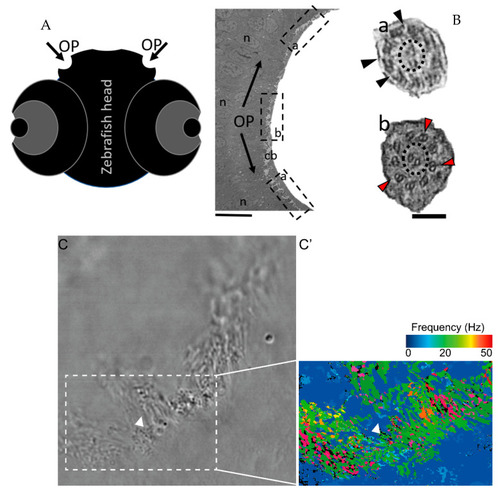
The zebrafish OP has two different types of cilia. (A) Schematic representation of 5 dpf zebrafish head, structures of interest are marked with arrows—olfactory pits (OP). (B) TEM low magnification image showing a cross-section across an OP of a WT zebrafish, a bowl-shaped structure containing multiciliated cells and cilia in several orientations. In the periphery of this pit (dotted boxes a and inset), cilia containing classical motile structure 9 + 2 with dynein arms (black arrowheads). In the most internal region of the OP (dotted box b and inset) we detected cilia with 9 + 2 ultrastructural arrangement without dynein arms (red arrowheads); this pattern was visible in WT embryos (n = 3). (C) Snapshot from a movie of beating OP cilia and respective heatmap by software CiliarMove (C’), highlighting a region of immotile cilia (arrowhead) that was coincident with the region detected by TEM in B. n—nucleus; cb—cilia border; OP—olfactory pit. Thin bar 6 µm, thick bar 100 nm. |
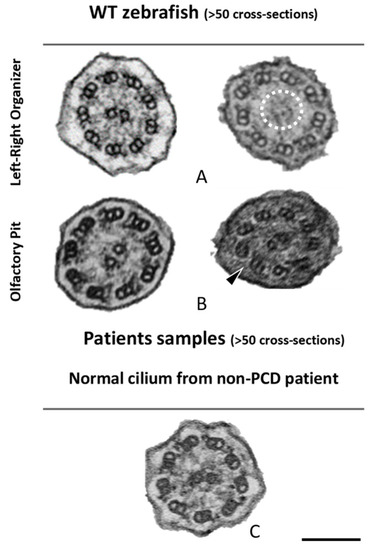
Ciliary ultrastructural comparison between the LRO, OP and human respiratory cilia. Variations of the axonemal arrangement of cilia in (A) the LRO of 10 somite stages WT zebrafish embryo and (B) the OP of 5 dpf WT zebrafish larvae. (C) Example of a human respiratory cilium cross-section from the airway. Arrowheads indicate missing ODA and the dotted circle shows missing CP. Scale bar 100 nm. |
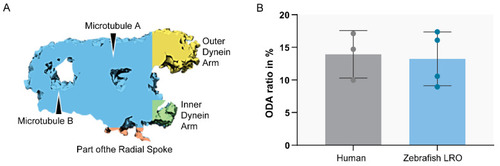
Ratio between ODA and MTD volume. Sub-tomographic averaging of the MTD of WT zebrafish cilia, showing ODA and IDA, tubules (A,B) and a portion of the radial spoke. The two sample groups were not significantly different (p > 0.05, Student’s t-test). N = 3 human patients and n = 4 zebrafish LROs. |
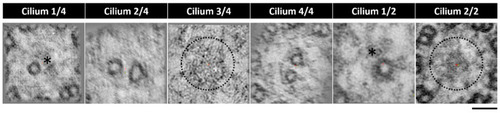
Tomogram z-projection confirms central pair heterogeneity. CPs from two different LROs (n = 2) and from six different cilia, showing variation in the presence of the CP. Cilium 1/4 and 1/2 showing only one tubule present, cilium 2/4 and 4/4 showing both tubules present and cilium 3/4 and 2/2 showing no tubules in the central pair region. * missing tubule, incomplete CP; dotted circle missing CP. Bar 50 nm. |