
Image
|
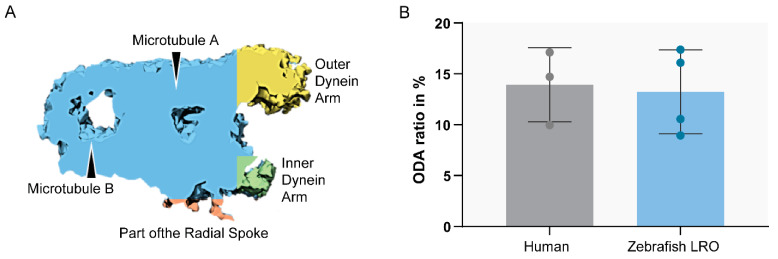
Figure Caption
Figure 6
Ratio between ODA and MTD volume. Sub-tomographic averaging of the MTD of WT zebrafish cilia, showing ODA and IDA, tubules (A,B) and a portion of the radial spoke. The two sample groups were not significantly different (p > 0.05, Student’s t-test). N = 3 human patients and n = 4 zebrafish LROs.
Acknowledgments
This image is the copyrighted work of the attributed author or publisher, and
ZFIN has permission only to display this image to its users.
Additional permissions should be obtained from the applicable author or publisher of the image.
Full text @ Int. J. Mol. Sci.