
- Title
-
Genetic and epigenetic orchestration of Gfi1aa-Lsd1-cebpα in zebrafish neutrophil development
- Authors
- Wu, M., Xu, Y., Li, J., Lian, J., Chen, Q., Meng, P., Lu, T., Xie, H., Zhang, W., Xu, J., Zhang, Y.
- Source
- Full text @ Development
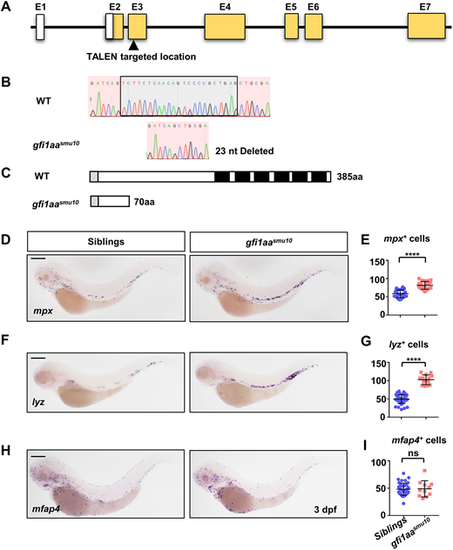
Neutrophil lineage is increased in gfi1aasmu10 mutant embryos. (A) Generation of the gfi1aasmu10 mutant by TALEN. The gfi1aa TALEN is located at exon (E) 3. White boxes and yellow boxes indicate 5′ untranslated region and coding sequence, respectively. (B) A 23 nucleotide (nt) deletion generates a frameshift transcript in the gfi1aasmu10 mutant. Black box indicates the deleted region. (C) The mutant is predicted to generate a truncated protein lacking the DNA-binding domain. The gray-boxed region indicates the SNAG domain and the black-boxed regions indicate the DNA-binding domain of Gfi1aa. (D-G) Increased neutrophil makers in the gfi1aasmu10 mutant. Expression and quantification of mpx (D,E) and lyz (F,G) in sibling and gfi1aasmu10 mutant embryos at 3 dpf by WISH. Signals in the caudal hematopoietic tissue (CHT) region were counted. ****P<0.0001 [Student's t-test; mpxsibling (mean/s.e.m./n)=58.5/2.1/26, mpxgfi1aa mutant=81.48/2.3/21; lyzsibling=49.38/1.70/47, lyzgfi1aa mutant=102.6/3.54/14]. (H,I) Expression (H) and quantification (I) of mfap4 in sibling and gfi1aasmu10 mutant embryos at 3 dpf by WISH. Signals in the CHT were counted. ns, not significant [P>0.05; Student's t-test; mfap4sibling (mean/s.e.m./n)=48.1/1.77/39, mfap4gfi1aa mutant=48.82/4.46/11]. Scale bars: 200 μm. EXPRESSION / LABELING:
PHENOTYPE:
|
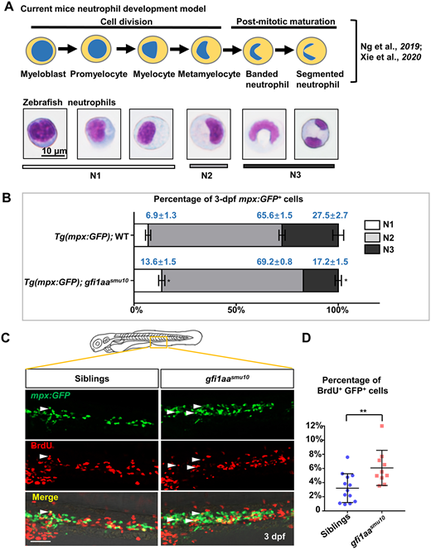
Proliferative neutrophil progenitors are accumulated in the gfi1aasmu10 mutant. (A) Murine neutrophil differentiation model compared with neutrophil morphology is integrated based on the reports of Ng et al. (2019) and Xie et al. (2020), and classification of zebrafish neutrophils is based on morphology. N1 represents myeloblasts, promyelocytes and myelocytes; N2 represents metamyelocytes; N3 represents banded and segmented neutrophils. Scale bar: 10 μm. (B) Quantification of mpx:GFP+ cells in each developing stage. Sorted neutrophil lineage cells from 3 dpf Tg(mpx:GFP);WT and Tg(mpx:GFP);gfi1aasmu10 mutants underwent May-Grünwald-Giemsa staining and were separated into N1, N2 and N3 groups according to their morphology. Mean±s.e.m. of three independent experiments. *P<0.05 (Student's t-test). (C,D) Increased BrdU+ proliferative mpx:GFP+ cells in gfi1aasmu10 mutant embryos. (C) Double antibody staining of BrdU and GFP. BrdU incorporation of GFP+ cells in the CHT in 3 dpf Tg(mpx:GFP);WT and Tg(mpx:GFP);gfi1aasmu10 mutants. White arrowheads indicate GFP/BrdU-positive cells. Scale bar: 50 μm. (D) Quantification of the percentages of CHT-localized BrdU+GFP+ cells. **P<0.01 [Student's t-test; siblings (mean/s.e.m./n)=3.2%/0.56%/13, gfi1aasmu10=6.1%/0.79%/10]. EXPRESSION / LABELING:
PHENOTYPE:
|

Increased cebpa expression in the gfi1aasmu10 mutant. (A) Relative expression of cebpa in FACS-sorted mpx:GFP+ cells. qPCR of 2 dpf and 3 dpf Tg(mpx:GFP);WT and Tg(mpx:GFP);gfi1aasmu10 mutants. **P<0.01 (Student's t-test; mean±s.e.m. of three independent experiments). (B,C) Upregulation of cebpa in gfi1aasmu10 mutant embryos. WISH of 2 dpf and 3 dpf sibling (left) and gfi1aasmu10 mutant (right) embryos. The numbers in top right corner indicate the number of embryos exhibiting this representative expression. Red arrows indicate the signals. P<0.0001 (Fisher's exact test). Scale bars: 200 μm. EXPRESSION / LABELING:
PHENOTYPE:
|
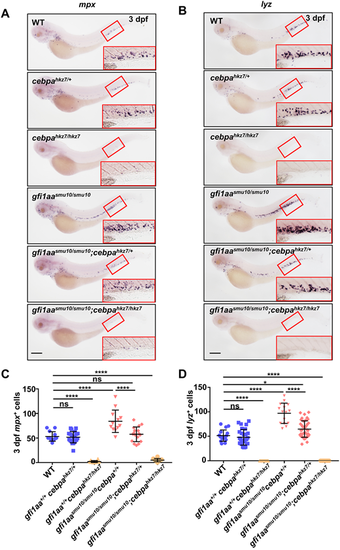
Downregulation of cebpa rescues the neutrophil lineage expansion of the gfi1aasmu10 mutant. (A,B) Expression of mpx (A) and lyz (B) in embryos of gfi1aasmu10/+ and cebpahkz7/+ outcrossed progeny. WISH of 3 dpf embryos of WT, gfi1aa+/+cebpahkz7/+, gfi1aa+/+cebpahkz7/hkz7, gfi1aasmu10/smu10cebpa+/+, gfi1aasmu10/smu10cebpahkz7/+ and gfi1aasmu10/smu10cebpahkz7/hkz7. Insets show enlargements of the red boxed regions of the CHT. Scale bars: 200 μm. (C,D) Quantification of mpx+ cells (C) and lyz+ cells (D) in each genotype group of mutants. Data are mean±s.d. nmpx=187, nlyz=241.*P<0.05, ****P<0.0001 (one-way ANOVA). ns, not significant (P>0.05). See also Tables S6 and S7. EXPRESSION / LABELING:
PHENOTYPE:
|

Gfi1aa targets the proximal promoter of cebpa. (A) cebpa-luciferase reporter activity in HEK 293T cells transfected with pCS2-gfi1aa or pCS2 vector. *P<0.05 (Student's t-test; mean±s.e.m. of three independent experiments). (B) Flowchart of Gfi1aa-eGFP ChIP-seq assay. One-cell-stage embryos were injected with pTol2-hsp-gfi1aa-eGFP construct and heat-shocked at 12 hpf for Gfi1aa-eGFP expression, and then the ChIP assay was performed at 15 hpf. (C) Visualization of Gfi1aa-binding sites by IGV. Gfi1aa-binding sites were detected on cebpa (top) and irf8 (middle) regulatory regions, but not on pu.1 (bottom), as shown by Gfi1aa-eGFP ChIP-seq peaks (red) compared with input control (gray). Blue boxes and lines indicate gene exons and introns, respectively. Black arrows above the TSS indicate the transcription direction. Green boxes under the red peaks indicate the significant binding peaks. |
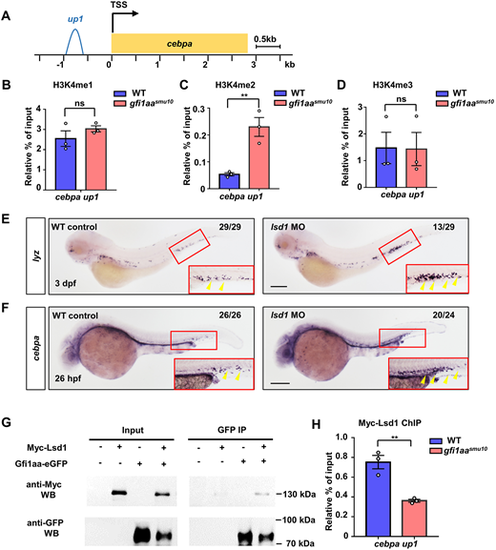
Gfi1aa epigenetically represses cebpa via Lsd1. (A) Schematic of the cebpa promoter. Gfi1aa binding on the cebpa promoter region is labeled with up1 (−0.6kb∼−0.9 kb). (B-D) ChIP-qPCR of the H3K4me1 (B), H3K4me2 (C) and H3K4me3 (D) status at the up1 cebpa promoter locus in WT and gfi1aasmu10 mutant embryos reveals that Gfi1aa inhibits H3K4me2 at the up1 locus of cebpa. Results are represented as percentage of input normalized to the negative control, etv2 exon 8. **P<0.01 (Student's t-test, mean±s.e.m. of three independent experiments). ns, not significant. (E,F) lsd1 MO phenocopies the neutrophil lineage expansion of the gfi1aasmu10 mutant. (E) Expression of lyz in WT control (n=29) and lsd1 MO (n=29) embryos at 3 dpf by WISH. (F) Expression of cebpa in WT control (n=26) and lsd1 MO (n=24) embryos at 26 hpf by WISH. The numbers in the top right corners indicate the number of embryos exhibiting the representative expression. Insets show enlargements of the red boxed regions of the CHT. Yellow arrowheads indicate the signals Scale bars: 200 μm. P<0.0001 (Fisher's exact test). (G) Protein interaction of Myc-Lsd1 and Gfi1aa-eGFP. Co-immunoprecipitation of Myc-tagged Lsd1 and eGFP-tagged Gfi1aa in zebrafish embryos. (H) Myc-Lsd1 binding to the cebpa locus is dependent on Gfi1aa. ChIP-qPCR shows Myc-Lsd1 enrichment in the cebpa promoter locus in WT and gfi1aasmu10 mutant embryos. Data are represented as percentage of input normalized to the negative control, etv2 exon 8. **P<0.01 (Student's t-test, mean±s.e.m. of three independent experiments) EXPRESSION / LABELING:
PHENOTYPE:
|
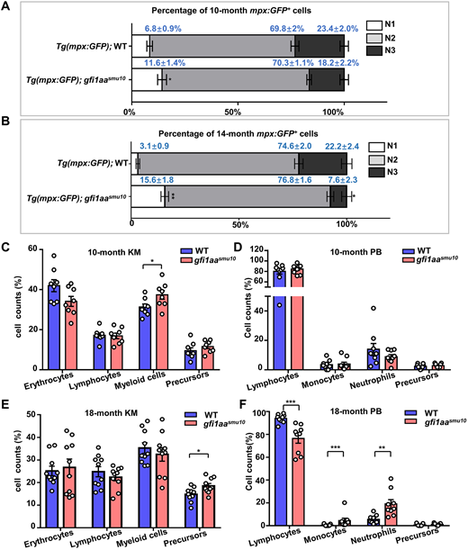
Adult gfi1aasmu10 mutants display hematological disorders. (A) The neutrophil progenitor portion is increased in 10-month-old adult gfi1aasmu10 mutants. Sorted neutrophil lineage cells from the KM of 10-month-old Tg(mpx:GFP);WT and Tg(mpx:GFP);gfi1aasmu10 mutants were subjected to May-Grünwald-Giemsa staining and separated into N1, N2 and N3 groups according to their morphology. *P<0.05 (Mann–Whitney test, n=7). Data are mean±s.e.m. (B) The neutrophil progenitor proportion is increased, whereas the well-differentiated neutrophil portion is decreased in 14-month-old adult gfi1aasmu10 mutants. *P<0.05, **P<0.01 (Mann–Whitney test, n=3). Data are mean±s.e.m. (C,D) Blood cell counts of KM (C; *P<0.05, Student's t-test, n=8) and PB (D, n=9) in 10-month-old fish were determined manually according to their morphology. Data are mean±s.e.m. (E,F) Blood cell counts of KM (E; *P<0.05, Student's t-test, n=10) and PB (E; *P<0.05, **P<0.01, ***P<0.001, Student's t-test and Mann–Whitney test, n=9) in 18-month-old fish were determined manually according to their morphology. Data are mean±s.e.m. |