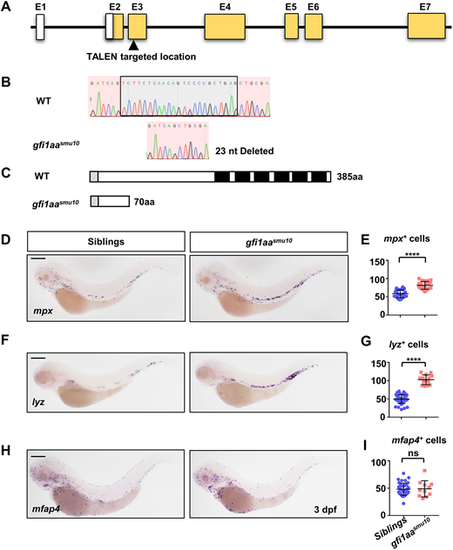
Neutrophil lineage is increased in gfi1aasmu10 mutant embryos. (A) Generation of the gfi1aasmu10 mutant by TALEN. The gfi1aa TALEN is located at exon (E) 3. White boxes and yellow boxes indicate 5′ untranslated region and coding sequence, respectively. (B) A 23 nucleotide (nt) deletion generates a frameshift transcript in the gfi1aasmu10 mutant. Black box indicates the deleted region. (C) The mutant is predicted to generate a truncated protein lacking the DNA-binding domain. The gray-boxed region indicates the SNAG domain and the black-boxed regions indicate the DNA-binding domain of Gfi1aa. (D-G) Increased neutrophil makers in the gfi1aasmu10 mutant. Expression and quantification of mpx (D,E) and lyz (F,G) in sibling and gfi1aasmu10 mutant embryos at 3 dpf by WISH. Signals in the caudal hematopoietic tissue (CHT) region were counted. ****P<0.0001 [Student's t-test; mpxsibling (mean/s.e.m./n)=58.5/2.1/26, mpxgfi1aa mutant=81.48/2.3/21; lyzsibling=49.38/1.70/47, lyzgfi1aa mutant=102.6/3.54/14]. (H,I) Expression (H) and quantification (I) of mfap4 in sibling and gfi1aasmu10 mutant embryos at 3 dpf by WISH. Signals in the CHT were counted. ns, not significant [P>0.05; Student's t-test; mfap4sibling (mean/s.e.m./n)=48.1/1.77/39, mfap4gfi1aa mutant=48.82/4.46/11]. Scale bars: 200 μm.
|
