
- Title
-
CHAF1A Blocks Neuronal Differentiation and Promotes Neuroblastoma Oncogenesis via Metabolic Reprogramming
- Authors
- Tao, L., Moreno-Smith, M., Ibarra-García-Padilla, R., Milazzo, G., Drolet, N.A., Hernandez, B.E., Oh, Y.S., Patel, I., Kim, J.J., Zorman, B., Patel, T., Kamal, A.H.M., Zhao, Y., Hicks, J., Vasudevan, S.A., Putluri, N., Coarfa, C., Sumazin, P., Perini, G., Parchem, R.J., Uribe, R.A., Barbieri, E.
- Source
- Full text @ Adv Sci (Weinh)
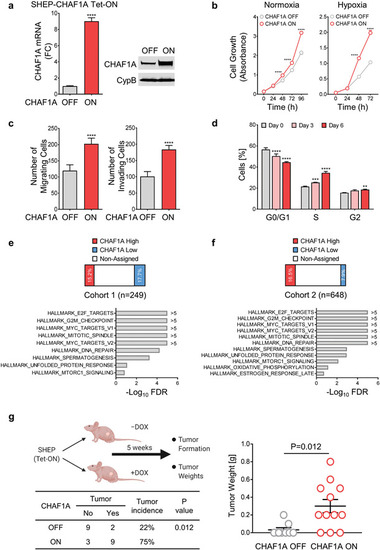
CHAF1A promotes NB aggressiveness. a) CHAF1A is turned on upon DOX induction (1 µg mL−1 for 72 h) in SHEP cells. Validation of CHAF1A overexpression by qPCR and western blotting is shown. Date are mean ± SD ( |
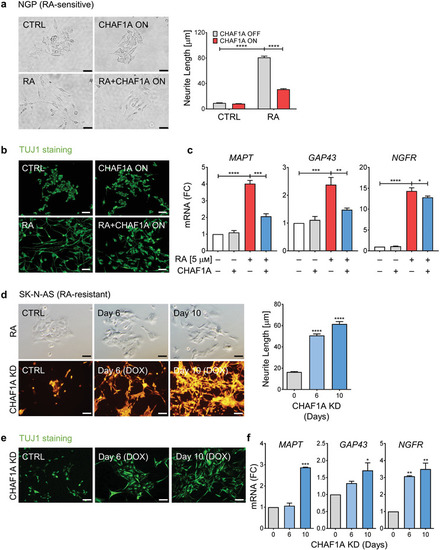
CHAF1A blocks RA‐induced cell differentiation. a) Bright field images of neurite outgrowth and quantification of neurite length. RA‐sensitive NGP cells were treated with RA (5 |

CHAF1A blocks NC differentiation. a) Schematic presentation of early NCC events during zebrafish development. hpf = hours post fertilization. b) Spatial‐temporal expression of EXPRESSION / LABELING:
|
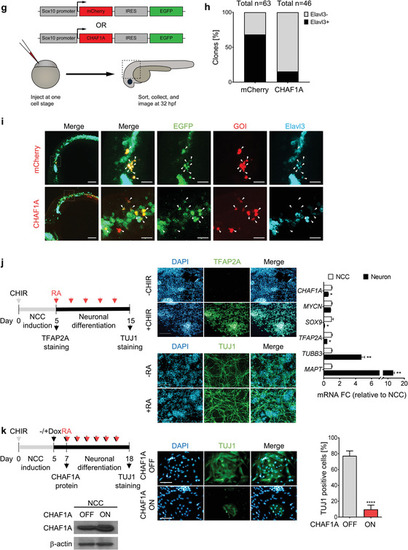
CHAF1A blocks NC differentiation. a) Schematic presentation of early NCC events during zebrafish development. hpf = hours post fertilization. b) Spatial‐temporal expression of |
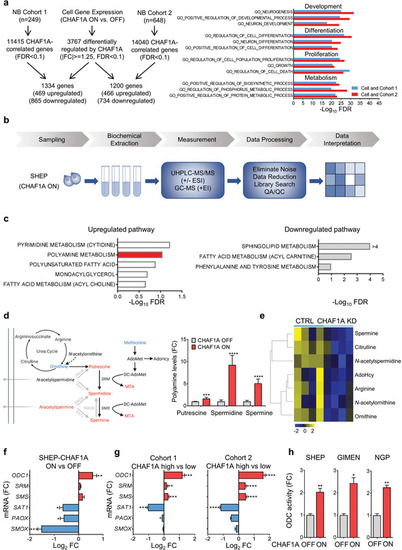
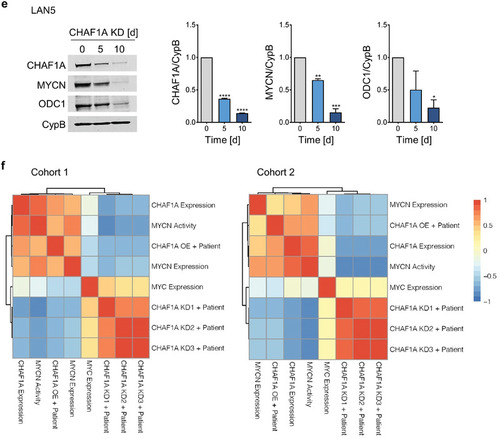
CHAF1A gene expression and pathway analyses of NB cells and patients. a) Left: overlap of differentially expressed genes (DEGs, |(fc)| > = 1.25, FDR < 0.1) between control (CHAF1A OFF) and CHAF1A‐overexpressing SHEP cells (CHAF1A ON, 96 h) and |

Inhibition of polyamine synthesis restores neuronal differentiation. a,b) Neurite length and TUJ1 immunofluorescence staining in NGP‐CHAF1A cells treated with RA (5 |
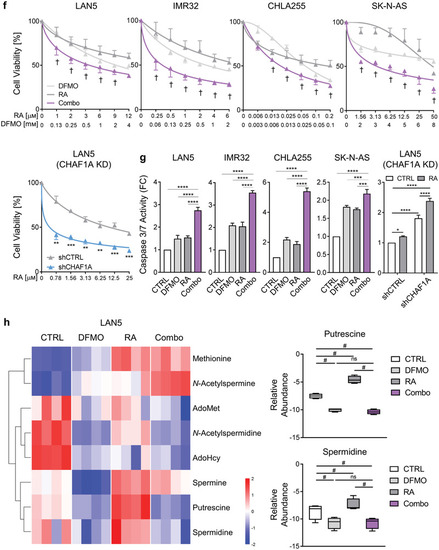
Inhibition of polyamine synthesis restores neuronal differentiation. a,b) Neurite length and TUJ1 immunofluorescence staining in NGP‐CHAF1A cells treated with RA (5 |
Inhibition of polyamine synthesis restores neuronal differentiation. a,b) Neurite length and TUJ1 immunofluorescence staining in NGP‐CHAF1A cells treated with RA (5 |
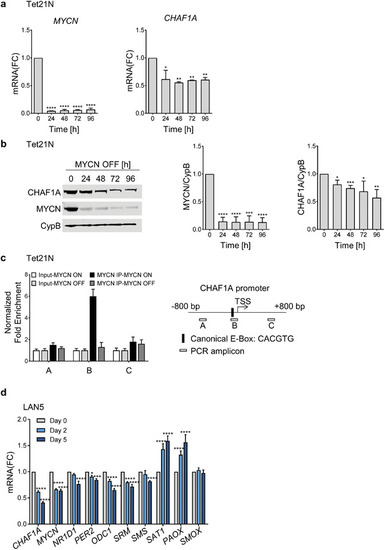
CHAF1A is a direct target of MYCN. a,b) mRNA and protein expression of CHAF1A in TET‐21/N cells when MYCN is turned off upon DOX treatment (2 µg mL−1, 24–96 h). GAPDH is used as housekeeping gene, CypB as protein loading control. Data are mean ± SD ( |
CHAF1A is a direct target of MYCN. a,b) mRNA and protein expression of CHAF1A in TET‐21/N cells when MYCN is turned off upon DOX treatment (2 µg mL−1, 24–96 h). GAPDH is used as housekeeping gene, CypB as protein loading control. Data are mean ± SD ( |