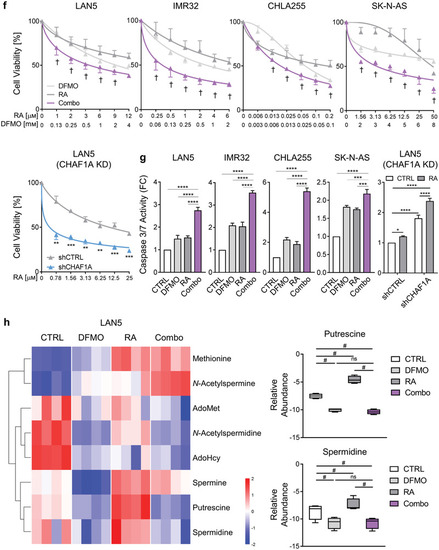
Inhibition of polyamine synthesis restores neuronal differentiation. a,b) Neurite length and TUJ1 immunofluorescence staining in NGP‐CHAF1A cells treated with RA (5 μм), DOX (1 µg mL−1), and DFMO (0.5 mм) for 72 h. Data are mean ± SEM (n > 300); ****p < 0.0001; one‐way ANOVA with Tukey's multiple comparisons test. Scale bar = 50 µm. c) Cell cycle analysis of NGP‐CHAF1A cells treated with DOX (1 µg mL−1) or DFMO (0.5 mм) for 72 h. Data are mean ± SD (n = 2); *p < 0.05, **p < 0.01, ***p < 0.001, ****p < 0.0001; two‐way ANOVA with Tukey's multiple comparisons test. d) Neuronal outgrowth of IMR32 CHAF1A KD cells in the presence or absence of ODC1 overexpression. Neurite length is quantified using Image J2 and presented as mean ± SEM (n > 300); ****p < 0.0001; one‐way ANOVA with Tukey's multiple comparisons test. Scale bar = 50 µm. e) Cell cycle analysis of IMR32 CHAF1A KD cells in the presence or absence of ODC1 overexpression. Data are mean ± SD (n = 2); ****p < 0.0001; two‐way ANOVA with Tukey's multiple comparisons test. f) Cell viability of LAN5, IMR32, CHLA255, and SK‐N‐AS cells treated with increasing concentrations of DFMO single agent, RA single agent, and their combination (combo). Cell viability of LAN5 shCTRL and shCHAF1A cells treated with increasing doses of RA. Data are mean ± SD (n = 3). †synergy with CI < 1; **p < 0.01; ***p < 0.001; two‐sided unpaired t‐test. g) Apoptosis of LAN5, IMR32, CHLA255, and SK‐N‐AS cells treated with DFMO, RA, and combo (IC50–75). Apoptosis of LAN5 shCTRL and shCHAF1A cells treated with RA (IC50). Data are mean ± SD (n = 3); * p < 0.05, ** p < 0.01, *** p < 0.001, **** p < 0.0001; two‐way ANOVA with Tukey's multiple comparisons test. h) Polyamine metabolites in LAN5 cells treated with DFMO (1 mм), RA (10 μм), and combo for 5 days (n = 4). Metabolites with FDR < 0.05 in at least one comparison are shown in the heatmap (red = upregulated; blue = downregulated); two‐way ANOVA with original FDR method of Benjamini and Hochberg. The relative abundance of putrescine and spermidine are presented in box and whiskers plots. # indicates FDR < 0.05. i) Top, scheme of RA+DFMO study in LAN5 luc orthotopic xenograft model. Mice were treated with vehicle (1% methylcellulose, p.o., b.i.d., 5 days per week), RA (p.o., 40 mg kg−1 b.i.d., 5 days per week), DFMO (2% in sterile water, replaced weekly), and their combination for three weeks. Bottom left, tumor weights post treatment. Mean ± SEM (n = 8–11); Mann–Whitney test. Bottom right, cleaved caspase‐3 staining and quantification in tumors. Scale bar = 20 µm. Mean ± SEM (n = 6); Mann–Whitney test. j) Top, scheme of RA study in LAN5 luc shCHAF1A versus shCTRL orthotopic xenograft model. Mice were treated with vehicle (1% methylcellulose, p.o., b.i.d., 5 days per week) or RA (p.o., 40 mg kg−1 b.i.d., 5 days per week) for 3 weeks. Bottom left, tumor weights post treatment. Mean ± SEM (n = 9–10); Mann–Whitney test. Bottom right, cleaved caspase‐3 staining and quantification in tumors. Scale bar = 20 µm. Mean ± SEM (n = 5–6); Mann–Whitney test. FC = fold change; ns = not significant.
|
