IMAGE

Figure 2

ID
ZDB-IMAGE-211014-10
Source
Figures for Tao et al., 2021
Image
Figure Caption

Figure 2

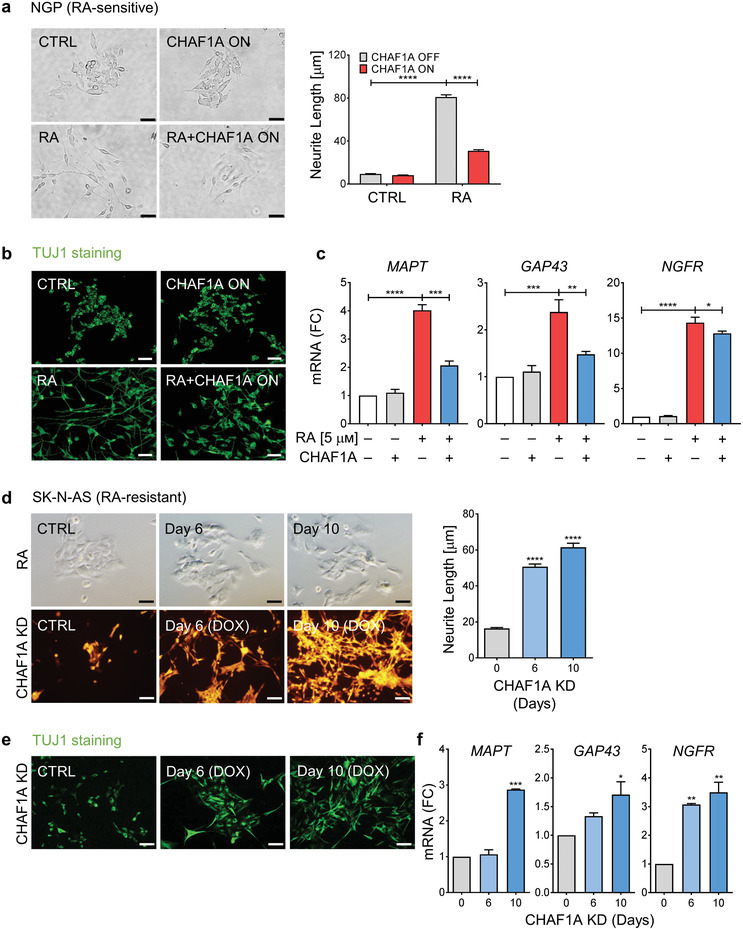
CHAF1A blocks RA‐induced cell differentiation. a) Bright field images of neurite outgrowth and quantification of neurite length. RA‐sensitive NGP cells were treated with RA (5 μм) in the presence or absence of CHAF1A induction for 72 h. Neurite length was quantified by Image J2 and presented as mean ± SEM (n > 300, two biological replicates); ****p < 0.0001; two‐way ANOVA with Tukey's multiple comparisons test. Scale bar = 50 µm. b) TUJ1 immunofluorescence staining. Scale bar = 50 µm. c) qPCR analysis of neuron‐specific marker genes (MAPT, GAP43, and NGFR). Mean ± SD (n = 3); *p < 0.05, **p < 0.01, ***p < 0.001, ****p < 0.0001; two‐sided unpaired t‐test. d) RA treatment (10 μм) and CHAF1A conditional KD (0–10 days) in RA‐resistant SK‐N‐AS cells. Neurite length is quantified by Image J2 and presented as mean ± SEM (n > 150, two biological replicates); ****p < 0.0001; one‐way ANOVA with Dunnett's multiple comparisons test. Scale bar = 100 µm. e) TUJ1 immunofluorescence staining. Scale bar = 50 µm. f) qPCR analysis of neuron‐specific genes (MAPT, GAP43, and NGFR). Mean ± SD (n = 2); *p < 0.05, **p < 0.01, ***p < 0.001; one‐way ANOVA with Dunnett's multiple comparisons test. KD = knockdown. FC = fold change.

Acknowledgments
This image is the copyrighted work of the attributed author or publisher, and ZFIN has permission only to display this image to its users. Additional permissions should be obtained from the applicable author or publisher of the image. Full text @ Adv Sci (Weinh)