V-ATPase mutant embryos show neuromast defects. (A) Diagram of the V-ATPase holoenzyme complex. The cytosolic V1 domain contains subunits A-H and hydrolyzes ATP, and the Vo domain inserts into membrane and translocates protons (H+). The accessory protein AP1 interacts with the Vo domain. Adapted from Collins and Forgac (2018) and Abbas et al. (2020) under the terms of the CC-BY 4.0 license. (B) Diagram of a lateral view of a zebrafish neuromast with centrally organized hair cells (orange) surrounded by support cells (green). Each hair cell has a single kinocilium (pink), a staircase of stereocilia (red) and a nucleus (blue). (C) Wild-type and atp6v1f−/− embryos at 4 dpf expressing the Tg(scm1:GFP) transgene that labels lateral line neuromasts (white arrowheads). Scale bars: 500 µm. (D) Top-down view of neuromasts in wild-type, atp6v1f−/− and atp6v1h−/− embryos labeled with acetylated tubulin to mark hair cells (magenta) and DAPI to stain nuclei (blue). Dashed line circles indicate the approximate neuromast boundary. (E,F) Quantification of neuromast area in atp6v1f−/− (E) and atp6v1h−/− (F) embryos at 4 dpf relative to wild-type (WT) siblings. n=number of embryos examined. ***P=0.0002, ****P<0.0001 by unpaired Student's t-test with Welch's correction. (G) Pseudo-colored scanning electron micrographs of wild-type, atp6v1f−/− and atp6v1h−/− neuromasts at 4 dpf with pink representing kinocilia and red representing stereocilia. Scale bars: 1 µm.

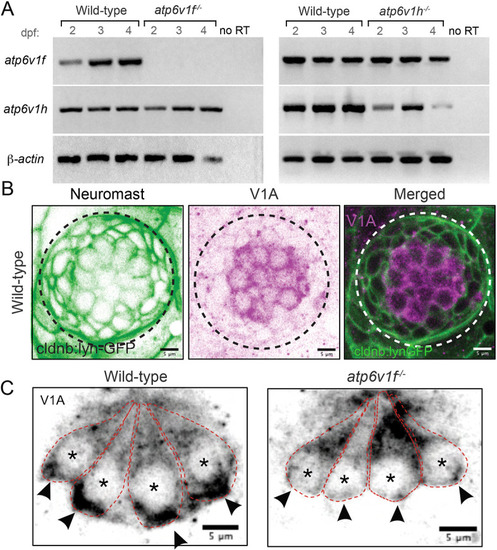
(A) Reverse transcriptase (RT)-PCR analysis of total mRNA from wild-type and V-ATPase mutant embryos at 2, 3 and 4 dpf. atp6v1f mRNA is not detected in atp6v1f−/− embryos, whereas atp6v1h mRNA is detected in the atp6v1h−/− embryos. β-actin mRNA was amplified as a positive control, and reactions without reverse transcriptase (no RT) were negative controls. (B) Antibodies against the V-ATPase V1A subunit (magenta) show enriched staining in centrally localized hair cells in a wild-type neuromast labeled by Tg(cldnb:lynEGFP) expression (green). Dashed line circles indicate the neuromast boundary. (C) Optical sections of hair cells reveal that the V1A subunit localizes throughout wild-type hair cells with an accumulation in the basal region. This basal localization is disrupted in atp6v1f−/− mutant hair cells. Approximate boundaries of individual hair cells are outlined, and asterisks mark hair cell nuclei. Arrowheads indicate basal accumulation of V1A in wild-type hair cells, and lack thereof in atp6v1f−/− hair cells.

V-ATPase loss of function alters pH and induces autophagy defects in neuromasts. (A) Lysotracker staining in a wild-type neuromast at 4 dpf was reduced in atp6v1f−/− mutants. Neuromast cells are marked by Tg(cldnb:lynEGFP) transgene expression. Arrowheads point out basal accumulation of Lysotracker in wild-type hair cells. Scale bars: 5 µm. (B) Wild-type and atp6v1f−/− mutant neuromasts at 4 dpf stained for Lc3b-GFP (green) and nuclei using DAPI (blue). Arrowheads point out Lc3b-GFP aggregates. White and black dashed line circles indicate the neuromast boundary. (C) Quantification of volume of individual Lc3b-GFP aggregates in neuromasts from wild-type and atp6v1f−/− embryos. The number of data points reflects the finding that each embryo can have multiple neuromast aggregates. n=number of embryos. ***P=0.0005 and ****P<0.0001 by unpaired Student's t-test with Welch's correction. (D) Anti-Lamp1 antibody staining shows colocalization with Lc3b-GFP aggregates in atp6v1f−/− mutant neuromast. Yellow dashed line circles indicate hair cell cluster within a neuromast.

V-ATPase loss reduces the number of hair cells in neuromasts. (A) Acetylated tubulin staining detects hair cells in wild-type, atp6v1f−/− and atp6v1h−/− neuromasts at 2 dpf and 4 dpf. Arrowheads point to individual hair cells. (B,C) The number of hair cells per neuromast at 2 dpf and 4 dpf in atp6v1f−/− embryos and wild-type siblings (B), and atp6v1h−/− and wild-type siblings (C). (D) Sox2 staining labels neuromast support cells at 2 dpf and 4 dpf. Dashed line circles indicate the neuromast boundary. (E,F) The number of support cells per neuromast at 2 dpf and 4 dpf in atp6v1f−/− embryos and wild-type siblings (E), and atp6v1h−/− and wild-type siblings (F). n=number of embryos. ***P=0.0009 and ****P<0.0001 by unpaired Student's t-test with Welch's correction. ns, not significant.

Loss of V-ATPase does not alter proliferation but induces hair cell death in mutant neuromasts. (A,B) A 1-h pulse with BrdU results in a similar number of BrdU-positive cells in wild-type and atp6v1f−/− neuromasts at 2 dpf and 3 dpf. Representative images show BrdU-labeled cells (orange) and DAPI-stained neuromast nuclei (blue). Arrowheads denote pyknotic nuclei. Dashed line circles indicate the neuromast boundary. (B) Quantification of the number of BrdU-labeled cells per neuromast at 2 dpf and 3 dpf. (C,D) The number of pyknotic nuclei increases from 2 dpf through 4 dpf in both atp6v1f−/− (C) and atp6v1h−/− (D) neuromasts. (E) Snapshots from live time-lapse imaging of wild-type and atp6v1f−/− hair cells marked by Tg(myo6b:tdtomato) expression. The arrowhead follows a single hair cell in the atp6v1f−/− neuromast over time as it dies. Fluorescent tdTomato protein accumulates into aggregates that are reminiscent of LC3b-GFP aggregates (see Fig. 3). Wild-type hair cells remained healthy. Scale bars: 5 µm. n=number of embryos. ***P=0.0009 and ****P<0.0001 by unpaired Student's t-test with Welch's correction. ns, not significant.

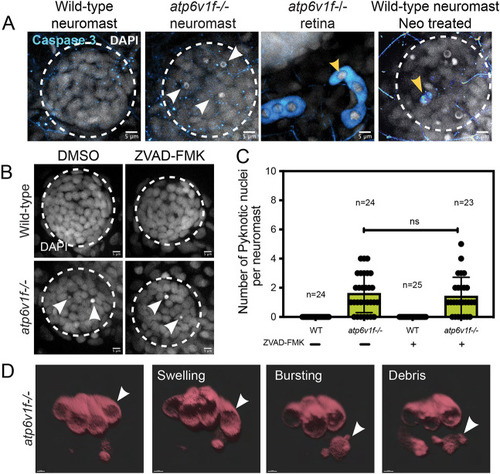
(A) Cleaved Caspase 3 staining was absent in wild-type and atp6v1f−/− mutant neuromasts at 4 dpf, but was detected in the retina of atp6v1f−/− embryos, and in wild-type hair cells treated with neomycin (Neo) that induces Caspase 3 activation (yellow arrowheads). Nuclei were detected using DAPI. White arrowheads indicate pyknotic nuclei. (B) DAPI staining of neuromast nuclei at 4 dpf in wild-type and atp6v1f−/− embryos treated with either DMSO (control) or 300 µM ZVAD-FMK from 2 dpf to 4 dpf. White arrowheads indicate pyknotic nuclei. Dashed line circles indicate the neuromast boundary. Scale bars: 5 µm. (C) Quantification of pyknotic nuclei per neuromast in control and 300 µM ZVAD-FMK-treated embryos. n=number of embryos. ns, not significant by unpaired Student's t-test with Welch's correction. (D) 3D rendering of time-lapse snapshots of Tg(myo6b:tdtomato); atp6v1f−/− hair cells undergoing necrosis-like morphological changes. The white arrowhead follows one hair cell swelling and then bursting over time. Scale bars: 3 µm.

Reduced mitochondrial membrane potential contributes to hair cell death in V-ATPase mutant neuromasts. (A) The vital dyes MitoTracker and TMRE were used to assess mitochondrial mass and mitochondrial transmembrane potential, respectively, in live wild-type and atp6v1f−/− embryos at 4 dpf. Dashed line circles indicate the neuromast boundary. (B,C) Quantification of mean fluorescence intensity measurements per neuromast of MitoTracker (B) and TMRE (C) in wild-type and atp6v1f−/− embryos at 4 dpf. (D) Ratio of TMRE fluorescence intensity to MitoTracker. n=number of embryos. ****P<0.0001 by unpaired Student's t-test with Welch's correction. (E) Representative images of acetylated tubulin immunostaining of hair cells in wild-type and atp6v1f−/− embryos at 4 dpf after treatment with DMSO (vehicle control), CsA or RU360 from 2 dpf to 4 dpf. Arrowheads point to individual hair cells. (F,G) The number of hair cells per neuromast in control embryos and embryos treated with CsA (F) or RU360 (G). n=number of embryos. *P<0.04 by two-way ANOVA with Bonnferroni–Šidák post hoc test.

Acknowledgments
This image is the copyrighted work of the attributed author or publisher, and ZFIN has permission only to display this image to its users. Additional permissions should be obtained from the applicable author or publisher of the image. Full text @ Dis. Model. Mech.