IMAGE

Fig. 4.

ID
ZDB-IMAGE-210801-90
Antibodies
Source
Figures for Santra et al., 2021
Image
Figure Caption

Fig. 4.

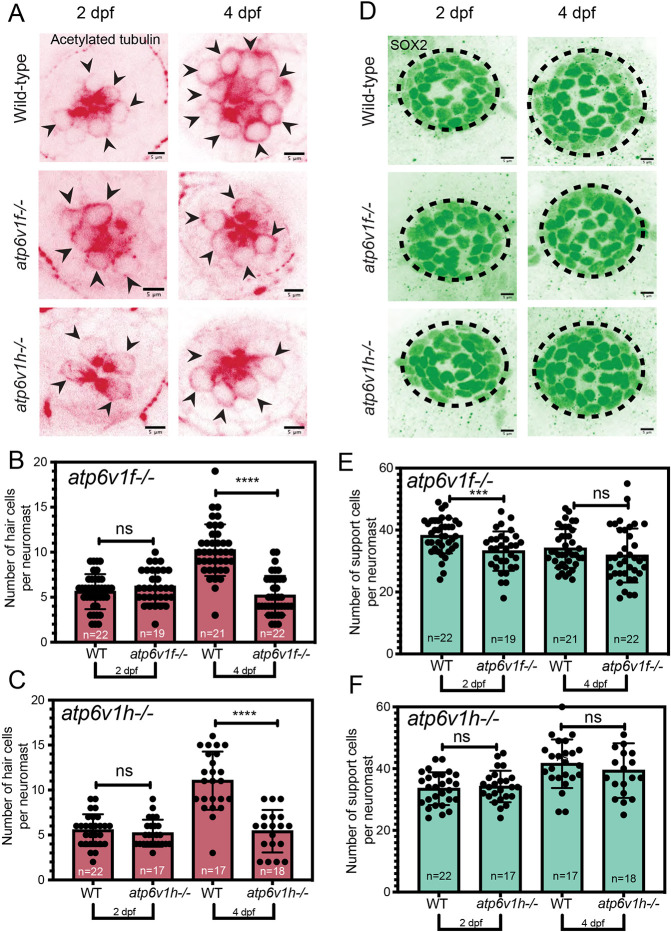
V-ATPase loss reduces the number of hair cells in neuromasts. (A) Acetylated tubulin staining detects hair cells in wild-type, atp6v1f−/− and atp6v1h−/− neuromasts at 2 dpf and 4 dpf. Arrowheads point to individual hair cells. (B,C) The number of hair cells per neuromast at 2 dpf and 4 dpf in atp6v1f−/− embryos and wild-type siblings (B), and atp6v1h−/− and wild-type siblings (C). (D) Sox2 staining labels neuromast support cells at 2 dpf and 4 dpf. Dashed line circles indicate the neuromast boundary. (E,F) The number of support cells per neuromast at 2 dpf and 4 dpf in atp6v1f−/− embryos and wild-type siblings (E), and atp6v1h−/− and wild-type siblings (F). n=number of embryos. ***P=0.0009 and ****P<0.0001 by unpaired Student's t-test with Welch's correction. ns, not significant.

Figure Data
Acknowledgments
This image is the copyrighted work of the attributed author or publisher, and ZFIN has permission only to display this image to its users. Additional permissions should be obtained from the applicable author or publisher of the image. Full text @ Dis. Model. Mech.