
- Title
-
The role of Gdf5 in the development of the zebrafish fin endoskeleton
- Authors
- Waldmann, L., Leyhr, J., Zhang, H., Allalou, A., Öhman-Mägi, C., Haitina, T.
- Source
- Full text @ Dev. Dyn.
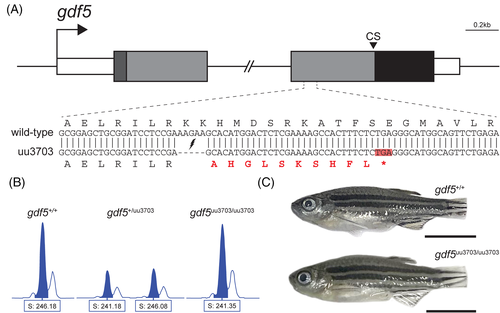
Zebrafish gdf5 knockout generated with CRISPR/Cas9. (A) To-scale schematic of the two-exon gdf5 gene locus on chromosome 6, with the 4267 bp intron truncated. White boxes represent the 5′ and 3′ UTRs, the dark grey box represents the sequence coding for the 22 aa signal peptide, the light grey boxes represent the sequences coding for the rest of the prodomain (334 aa), and the black box represents the sequence coding for the 118 aa mature domain. “CS” indicates the position of the 5 aa cleavage site. The sequence of the zoomed in section of exon 2 shows the alignment between the wild-type and mutant (uu3703) alleles. The mutant allele has a 5-base deletion that results in a frameshift and a premature stop codon highlighted in red. (B) Wild-type, heterozygous gdf5+/uu3703, and homozygous gdf5uu3703/uu3703 fish were identified by fragment length analysis. The wild-type displayed one peak (246.18), gdf5+/uu3703 displayed one wild-type peak (246.08) and one mutant peak (241.18), and gdf5uu3703/uu3703 displayed one mutant peak (241.35). (C) At 60 dpf there is no outward phenotypic difference between gdf5uu3703/uu3703 and wild-type (caudal fins were clipped for genotyping). Scale bars: 5 mm
PHENOTYPE:
|
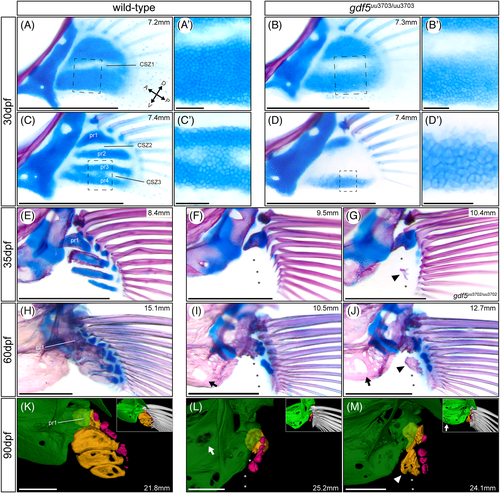
gdf5uu3703/uu3703 mutants display loss of pectoral fin radials. All images depict pectoral fins with postcleithra removed in a dorsomedial view. Bone- and cartilage-stained pectoral fins of wild-type and gdf5uu3703/uu3703 zebrafish at 30 dpf (A-D), 35 dpf (E-G), and 60 dpf (H-J). Dashed boxes (A-D) mark magnified regions (A′-D′). (F,G) pectoral fins of two 35 dpf gdf5uu3703/uu3703 and gdf5uu3702/uu3702 zebrafish, respectively, and (I,J) pectoral fins of two 60 dpf gdf5uu3703/uu3703 zebrafish, displaying variable presence of bone at the position of proximal radial 2 or 3. (K) pectoral fin of a 90 dpf nonsibling wild-type zebrafish following μCT scanning and 3D segmentation. (L,M) pectoral fin of 90 dpf gdf5uu3703/uu3703 zebrafish following μCT scanning and 3D segmentation. The measurements in mm refer to SL. Asterisks highlight the absence of proximal radials 2-4. Arrowheads indicate the variably present bone in place of proximal radial 2 in gdf5uu3703/uu3703 fish. Arrows indicate increased porosity in the shoulder girdle of gdf5uu3703/uu3703 fish. In μCT images, the shoulder girdle (green) is rendered partially transparent to provide unobstructed views of the proximal radials (orange). Fin rays (white) were removed for clarity and shown instead in the insets. Distal radials are colored in pink. CSZ, cartilage segmentation zone; pr, proximal radial. Scale bars: 500 μm (A-M), 50 μm (A′-D′)
|
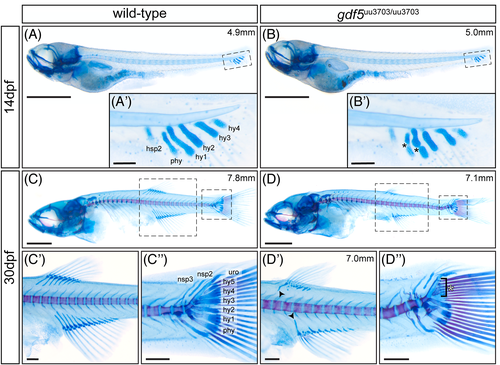
Skeletal staining reveals abnormalities in median fin skeletal organization in gdf5uu3703/uu3703 zebrafish. Lateral views of cartilage- and bone-stained wild-type fish at 14 dpf (A,A′) and 30 dpf (C,C′,C″); and gdf5uu3703/uu3703 fish at 14 dpf (B,B′) and 30 dpf (D,D′,D″). Dashed boxes (A-D) mark magnified regions (A′-D″). (B′) gdf5uu3703/uu3703 larvae display separation within the parhypural and hypural 1 cartilage condensations (black asterisks). (D′) Dorsal and anal fin radials are truncated in gdf5uu3703/uu3703 fish. The most anterior proximal radials tend to be less affected in both dorsal and anal fin (black arrowheads). This image is from a different mutant fish than displayed in (D). (D″) gdf5uu3703/uu3703 fish display truncated and slightly deformed and truncated hemal spines, parhypural and hypural 1. Hypural 3-5 are severely shortened in size (white asterisk). hsp, hemal spine; hy, hypural; nsp, neural spines; phy, parhypural; uro, uroneural. Scale bars: 1 mm (A-D), 100 μm (A′,B′) and 250 μm (C′-D″)
PHENOTYPE:
|
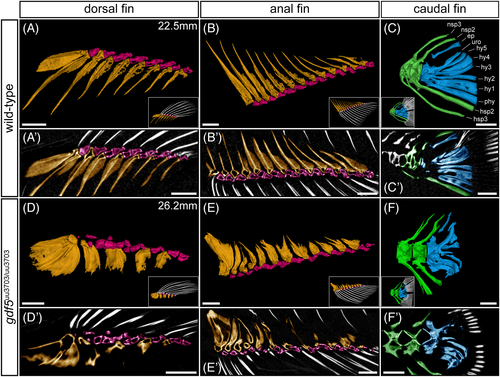
gdf5uu3703/uu3703 display defects in median fin skeletal elements. 90 dpf nonsibling wild-type (A-C), and gdf5uu3703/uu3703 (D-F) lateral views of the dorsal, anal, and caudal fin skeleton following μCT scanning and 3D segmentation (anterior to left). Fin rays (white) were removed for clarity and shown instead in the insets. (A′-F′) False-colored virtual thin sections of median fin skeletal elements. (A′,B′,D′,E′) 20 μm sections, (C′,F′) 30 μm sections. Proximal radials are colored in orange, distal radials in pink, epural, hypurals, and parhypural in blue, and preurals in green. ep, epural; hsp, hemal spine; hy, hypural; nsp, neural spine; phy, parhypural; uro, urostyle. Scale bars: 500 μm
PHENOTYPE:
|
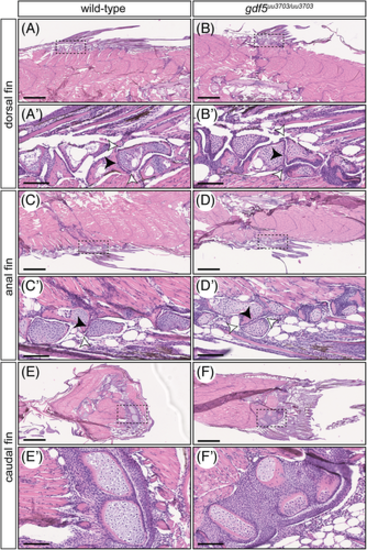
Median fin histology of adult wild-type and gdf5uu3703/uu3703 zebrafish reveals intact joints between distal and proximal radials and normal maturation of the skeletal elements. Sagittal sections from 60 dpf of wild-type (A,A,C,C′,E,E′) and gdf5uu3703/uu3703 (B,B′,D,D′,F,F′) zebrafish median fins stained with Hematoxylin and Eosin (HE). Anterior to the left, dorsal to the top. Dashed boxes in A-F mark magnified region in A′-F′. (A,A′,B,B′) Dorsal fin; (C,C′,D,D′) anal fin; (E,E′,F,F′) caudal fin. (A′-D′) White arrowheads indicate joint capsule, black arrowheads indicate articular cartilage. All joints are intact and do not display any differences when compared to wild-type. (E-F,E′-F′) Caudal fin skeletal elements display no apparent delay in chondrocyte maturation when compared to wild-type. Scale bars: 500 μm (A-F), 100 μm (A′-F′)
PHENOTYPE:
|
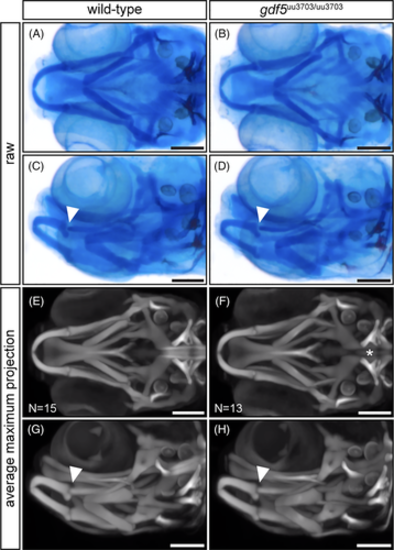
Optical projection tomography reveals no craniofacial skeletal defects in gdf5uu3703/uu3703 zebrafish at 9 dpf. (A-D) Examples of raw images of single 9 dpf zebrafish heads captured during OPT. (E-H) Maximum projection views of averaged 3D models generated by OPT analysis of 15 wild-type and 13 gdf5 mutant zebrafish at 9 dpf. Arrowheads indicate the jaw joint between Meckel's cartilage and the palatoquadrate. The asterisk highlights the reduced anterior notochord ossification in gdf5uu3703/uu3703 fish relative to wild-types. Scale bars: 150 μm
PHENOTYPE:
|
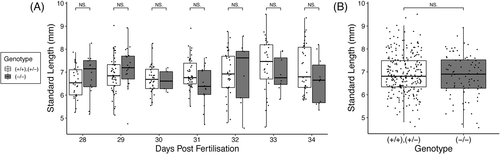
No significant differences in standard length between juvenile wild-type and gdf5uu3703/uu3703 zebrafish. (A) Standard lengths of sampled zebrafish between 28-34 dpf, broken down by age. (B) Pooled comparison of the standard lengths of all juvenile zebrafish in (A). N = 332. Genotype was inferred from the presence or absence of a skeletal phenotype. All wild-type to gdf5 mutant comparisons found no significant difference (P >0.050, Wilcoxon test), with the exception of 31 dpf which was significant in isolation (P = 0.024), but not after P-value adjustment for false discovery rate.53
PHENOTYPE:
|