
- Title
-
3,4-Difluorobenzocurcumin Inhibits Vegfc-Vegfr3-Erk Signalling to Block Developmental Lymphangiogenesis in Zebrafish
- Authors
- Okuda, K.S., Ng, M.F., Ruslan, N.F., Bower, N.I., Song, D.S.S., Chen, H., Baek, S., Crosier, P.S., Koltowska, K., Astin, J.W., Tan, P.J., Hogan, B.M., Patel, V.
- Source
- Full text @ Pharmaceuticals (Basel)
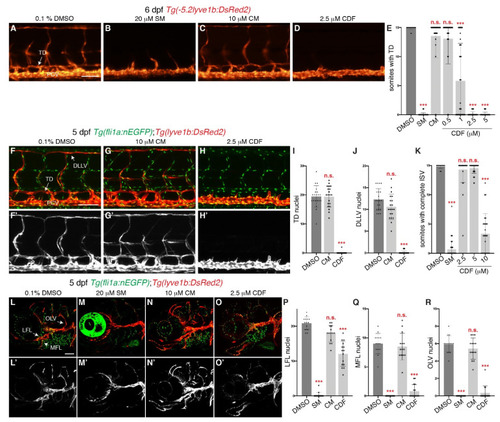
3,4-Difluorobenzocurcumin treatment inhibits trunk and facial lymphatic development in zebrafish. (A–D) Lateral fluorescent images of 6 dpf Tg(-5.2lyve1b:DsRed2) larvae treated with either 0.1% DMSO (A), 20 μM sunitinib malate (SM, B), 10 μM curcumin (CM, C), or 2.5 μM 3,4-Difluorobenzocurcumin (CDF, D). CDF inhibits lymphatic development in a dose-dependent manner in zebrafish. (E) Quantification of somites with thoracic duct (TD) tissue fragments in 6 dpf Tg(-5.2lyve1b:DsRed2) larvae treated with either 0.1% DMSO (n = 49 larvae), 20 μM SM (n = 51 larvae), 10 μM CM (n = 32 larvae), or CDF at 0.5 μM (n = 34 larvae), 1 μM (n = 37 larvae), 2.5 μM (n = 48 larvae), or 5 μM (n = 46 larvae). (F–H’) Lateral confocal images of 5 dpf Tg(fli1a:nEGFP);Tg(-5.2lyve1b:DsRed2) larvae treated with either 0.1% DMSO (F,F’), 10 μM CRM (G,G’), or 2.5 μM CDF (H,H’). Images (F’–H’) represent the Tg(-5.2lyve1b:DsRed2) expression of images (F–H). (I,J) Quantification of TD (I) or dorsal longitudinal lymphatic vessel (DLLV, J) nuclei across 9 somites in 5 dpf Tg(fli1a:nEGFP);Tg(-5.2lyve1b:DsRed2) larvae treated with either 0.1% DMSO (n = 20 larvae), 10 μM CM (n = 20 larvae), or 2.5 μM CDF (n = 24 larvae). (K) Quantification of somites with intersegmental vessels (ISVs) in 48 hpf Tg(fli1a:EGFP) embryos treated with either 0.1% DMSO (n = 47 embryos), 20 μM SM (n = 56 embryos), or CDF at 2.5 μM (n = 35 embryos), 5 μM (n = 39 embryos), or 10 μM (n = 27 embryos). CDF at 2.5 μM does not inhibit primary angiogenesis. Representative fluorescent images of graph K can be found in Figure S2A–E. (L–O’) Lateral confocal images of Tg(fli1a:nEGFP);Tg(-5.2lyve1b:DsRed2) larvae treated with either 0.1% DMSO (L,L’), 20 μM SM (M,M’), 10 μM CM (N,N’), or 2.5 μM CDF (O,O’). CDF at 2.5 μM blocks facial lymphatic development. Images (L’–O’) represent the Tg(-5.2lyve1b:DsRed2) expression of images (L–O). (P–R) Quantification of lateral facial lymphatic (LFL, P), medial facial lymphatic (MFL, Q), or otolithic lymphatic vessel (OLV, R) nuclei in 5 dpf Tg(fli1a:nEGFP);Tg(-5.2lyve1b:DsRed2) larvae treated with either 0.1% DMSO (n = 14 larvae), 20 μM SM (n = 16 larvae), 10 μM CM (n = 14 larvae), or 2.5 μM CDF (n = 15 larvae). Statistical test: Kruskal-Wallis test were conducted for graphs (E,I–K,P–R). PCV: posterior cardinal vein. p ≤ 0.001 (***) and n.s. indicates not significant. Scale bars: 100 μm. |
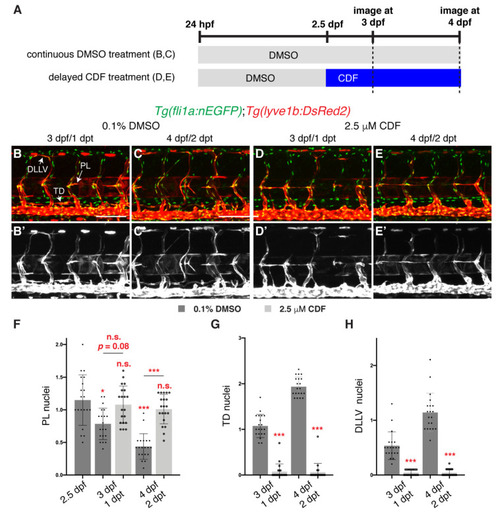
3,4-Difluorobenzocurcumin treatment inhibits lymphatic migration. (A) Schematic representation of the treatment schedule for larvae in images (B–E’). (B–E’) Lateral confocal images of 3 (1 days post-treatment (dpt), B,B’,D,D’) and 4 (2 dpt, C,C’,E,E’) dpf Tg(fli1a:nEGFP);Tg(-5.2lyve1b:DsRed2) larvae treated from 2.5 dpf with either 0.1% DMSO (B–C’) or 2.5 μM 3,4-Difluorobenzocurcumin (CDF, D-E’). LEC migration is stalled in larvae treated with CDF. Images (B’–E’) represent the Tg(-5.2lyve1b:DsRed2) expression of images (B–E). (F–H) Quantification of parachordal LECs (PL, F), thoracic duct (TD, G) or dorsal longitudinal lymphatic vessel (DLLV, H) nuclei per somite in Tg(fli1a:nEGFP);Tg(-5.2lyve1b:DsRed2) larvae treated with either 0.1% DMSO or 2.5 μM CDF at indicated timepoints (n = 20 embryos/larvae). Statistical test: Kruskal-Wallis test was conducted for graph F and Mann-Whitney test were conducted for graphs G and H. p ≤ 0.001 (***), p ≤ 0.05 (*), n.s. indicates not significant. Scale bars: 100 μm. |
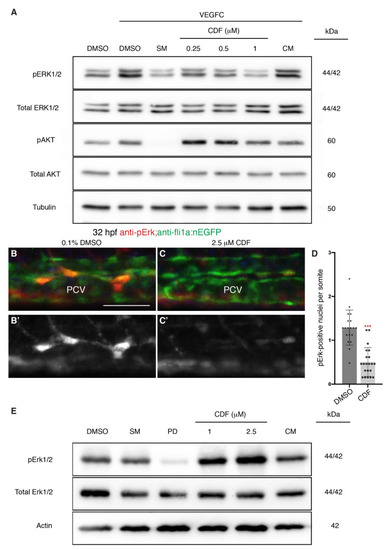
3,4-Difluorobenzocurcumin treatment attenuates VEGFC-induced phosphorylation of ERK in endothelial cells. (A) Western blot analysis of lysates isolated from human dermal lymphatic microvascular endothelial cells (HMVECs) treated with either 0.05% DMSO, 5 μM sunitinib malate (SM), 3,4-Difluorobenzocurcumin (CDF) at indicated concentrations, or 5 μM curcumin (CM) for 2 h and stimulated with vascular endothelial growth factor C (VEGFC) for 20 min (n ≥ 4). Protein levels of pERK1/2, total ERK1/2, pAKT, total AKT, and Tubulin were assessed. CDF treatment results in a dose-dependent reduction of phosphorylated ERK (pERK) level. The full-length blots are presented in Figure S4. (B–C’) Lateral confocal images of 32 hpf Tg(fli1a:nEGFP) embryos treated with either 0.1% DMSO (B) or 2.5 μM CDF (C) immunostained with anti-pErk (red) and anti-GFP (green) antibodies. CDF blocks phosphorylation of Erk in venous endothelial cells in vivo. Images (B’,C); represent the anti-pErk staining of images (B,C). (D) Quantification of pErk and fli1a:EGFP-positive nuclei per somite in the posterior cardinal vein (PCV) of 32 hpf Tg(fli1a:nEGFP) embryos treated with either 0.1% DMSO (n = 19 embryos) or 2.5 μM CDF (n = 21 embryos). (E) Western blot analysis of lysates isolated from 3 dpf zebrafish larvae treated with either 0.1% DMSO, 20 μM SM, 2 μM PD0325901, CDF at indicated concentrations, or 10 μM CM (n = 4). CDF is not a general inhibitor of Erk phosphorylation. Protein levels of pErk1/2, total Erk1/2, and Actin were assessed. The full-length blots are presented in Figure S5. Statistical test: Mann-Whitney test was conducted for graph (D). p ≤ 0.001 (***). Scale bar: 50 μm. |
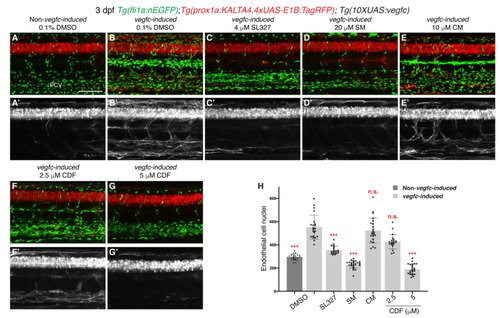
3,4-Difluorobenzocurcumin inhibits pathological phenotypes associated with vegfc overexpression. (A–G’) Lateral confocal images of either a 3 dpf Tg(prox1a:KALTA4,4xUAS-E1B:TagRFP);Tg(fli1a:nEGFP) larva (Non-vegfc-induced) treated with 0.1% DMSO (A,A’), or 3 dpf Tg(prox1a:KALTA4,4xUAS-E1B:TagRFP);Tg(10XUAS:vegfc);Tg(fli1a:nEGFP) larvae (vegfc-induced) treated with either 0.1% DMSO (B,B’), 4 μM SL327 (C,C’), 20 μM sunitinib malate (SM, D,D’), 10 μM curcumin (CM, E,E’), 2,5 μM 3,4-Difluorobenzocurcumin (CDF, F,F’), or 5 μM CDF (G,G’). Pathological vascular phenotypes in vegfc-induced embryos are rescued by CDF treatment. Images (A’–G’) represent the Tg(prox1a:KALTA4,4xUAS-E1B:TagRFP) expression of images (A–G). To avoid the robust prox1a expression in muscle cells, (A’–G’) are maximum projection images of only the z stacks that contain the posterior cardinal vein. Images (B’) (21/22 embryos), (E’) (23/23 embryos) and (F’) (14/20 embryos) show embryos with increased prox1a:KALTA4,4xUAS-E1B:TagRFP expression in venous endothelial cells. This pathological phenotype is rescued in images (C’) (20/20 embryos), (D’) (27/27 embryos) and (G’) (21/24 embryos). (H) Quantification of fli1a:EGFP-positive ECs across 4.5 somites in either 3 dpf non-vegfc-induced treated with 0.1% DMSO (n = 21 embryos) or 3 dpf vegfc-induced larvae treated with either 0.1% DMSO (n = 22 embryos), 4 μM SL327 (n = 20 embryos), 20 μM SM (n = 27 embryos), 10 μM CM (n = 23 embryos), or CDF at 2.5 μM (n = 20 embryos) or 5 μM (n = 24 embryos). PCV: posterior cardinal vein. Statistical test: Kruskal-Wallis test was conducted for graph H. p ≤ 0.001 (***) and n.s. indicates not significant. Scale bar: 100 μm. |
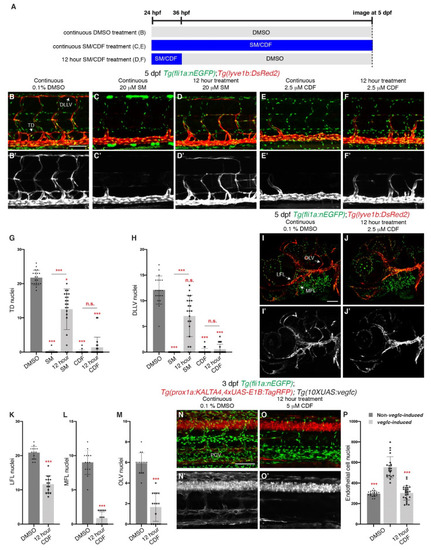
Brief treatment of 3,4-Difluorobenzocurcumin is sufficient to completely inhibit trunk and facial lymphatic development. (A) Schematic representation of the treatment schedule for larvae in images (B–F) and images (I,J). (B–F’) Lateral confocal images of 5 dpf Tg(fli1a:nEGFP);Tg(-5.2lyve1b:DsRed2) larvae either continuously treated with 0.1% DMSO (B,B’), 20 μM sunitinib malate (SM, C,C’) or 2.5 μM 3,4-Difluorobenzocurcumin (CDF, E,E’), or treated for 12 h with 20 μM SM (D,D’) or 2.5 μM CDF (F,F’). 12 h treatment of CDF inhibits trunk lymphatic development. Images (B’–F’) represent the Tg(-5.2lyve1b:DsRed2) expression of images (B–F). (G,H) Quantification of thoracic duct (TD, G) or dorsal longitudinal lymphatic vessel (DLLV, H) nuclei across 9 somites in 5 dpf Tg(fli1a:nEGFP);Tg(-5.2lyve1b:DsRed2) larvae treated with either 0.1% DMSO (n = 19 larvae), 20 μM SM (n = 24 larvae) or 2.5 μM CDF (n = 21 larvae), or treated for 12 h with 20 μM SM (n = 21 larvae) or 2.5 μM CDF (n = 21 larvae). (I–J’) Lateral confocal images of Tg(fli1a:nEGFP);Tg(-5.2lyve1b:DsRed2) larvae treated with either 0.1% DMSO (I,I’) or with 2.5 μM CDF for 12 h, then with 0.1% DMSO up to 5 dpf (J,J’). 12 h treatment of CDF inhibits facial lymphatic development. Images (I’,J’) represent the Tg(-5.2lyve1b:DsRed2) expression of images (I,J). (K–M) Quantification of lateral facial lymphatic (LFL, K, n ≥ 14), medial facial lymphatic (MFL, L, n ≥ 14), or otolithic lymphatic vessel (OLV, M, n ≥ 14) nuclei in 5 dpf Tg(fli1a:nEGFP);Tg(-5.2lyve1b:DsRed2) larvae either continuously treated with 0.1% DMSO (n = 14 larvae) or treated for 12 h with 2.5 μM CDF (n = 15 larvae). Datasets for 0.1% DMSO-treated 5 dpf Tg(fli1a:nEGFP);Tg(-5.2lyve1b:DsRed2) larvae are taken from Figure 1P–R. (N–O’) Lateral confocal images of 3 dpf Tg(prox1a:KALTA4,4xUAS-E1B:TagRFP);Tg(10XUAS:vegfc);Tg(fli1a:nEGFP) larvae (vegfc-induced) treated with either 0.1% DMSO (N,N’) or with 5 μM CDF for 12 h, then with 0.1% DMSO up to 3 dpf (O,O’). Pathological vascular phenotypes in vegfc-induced embryos are rescued by 12 h treatment of CDF. Images (N’,O’) represent the Tg(prox1a:KALTA4,4xUAS-E1B:TagRFP) expression of images (N,O). To avoid the robust prox1a expression in muscle cells, (N’,O’) are maximum projection images of only the z stacks that contain the posterior cardinal vein. Image (N’) (21/22 embryos) shows an embryo with increased prox1a:KALTA4,4xUAS-E1B:TagRFP expression in venous endothelial cells. This pathological phenotype is rescued in image (O’) (24/27 embryos). (P) Quantification of fli1a:EGFP-positive ECs across 4.5 somites in either 3 dpf Non-vegfc-induced (n = 21 embryos) or 3 dpf vegfc-induced larvae treated with either 0.1% DMSO (n = 22 embryos), or for 12 h with 5 μM CDF (n = 27 embryos). Datasets for 0.1% DMSO-treated 3 dpf Non-vegfc induced and vegfc-induced larvae are taken from Figure 4H. PCV: posterior cardinal vein. Statistical test: Mann-Whitney test were conducted for graph (K–M). Kruskal-Wallis test were conducted for graphs (G,H,P). p ≤ 0.001 (***) and n.s. indicates not significant. Scale bars: 100 μm. |