
Figure 1
- ID
- ZDB-FIG-210727-36
- Publication
- Okuda et al., 2021 - 3,4-Difluorobenzocurcumin Inhibits Vegfc-Vegfr3-Erk Signalling to Block Developmental Lymphangiogenesis in Zebrafish
- Other Figures
- All Figure Page
- Back to All Figure Page
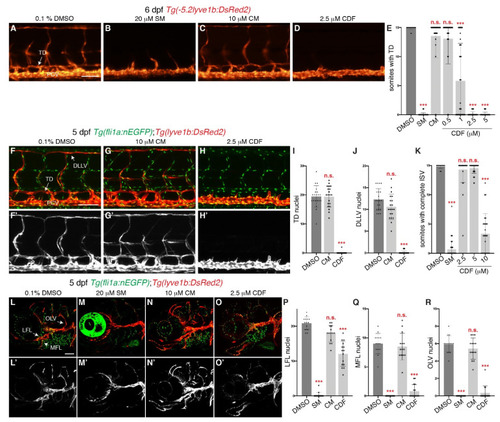
3,4-Difluorobenzocurcumin treatment inhibits trunk and facial lymphatic development in zebrafish. (A–D) Lateral fluorescent images of 6 dpf Tg(-5.2lyve1b:DsRed2) larvae treated with either 0.1% DMSO (A), 20 μM sunitinib malate (SM, B), 10 μM curcumin (CM, C), or 2.5 μM 3,4-Difluorobenzocurcumin (CDF, D). CDF inhibits lymphatic development in a dose-dependent manner in zebrafish. (E) Quantification of somites with thoracic duct (TD) tissue fragments in 6 dpf Tg(-5.2lyve1b:DsRed2) larvae treated with either 0.1% DMSO (n = 49 larvae), 20 μM SM (n = 51 larvae), 10 μM CM (n = 32 larvae), or CDF at 0.5 μM (n = 34 larvae), 1 μM (n = 37 larvae), 2.5 μM (n = 48 larvae), or 5 μM (n = 46 larvae). (F–H’) Lateral confocal images of 5 dpf Tg(fli1a:nEGFP);Tg(-5.2lyve1b:DsRed2) larvae treated with either 0.1% DMSO (F,F’), 10 μM CRM (G,G’), or 2.5 μM CDF (H,H’). Images (F’–H’) represent the Tg(-5.2lyve1b:DsRed2) expression of images (F–H). (I,J) Quantification of TD (I) or dorsal longitudinal lymphatic vessel (DLLV, J) nuclei across 9 somites in 5 dpf Tg(fli1a:nEGFP);Tg(-5.2lyve1b:DsRed2) larvae treated with either 0.1% DMSO (n = 20 larvae), 10 μM CM (n = 20 larvae), or 2.5 μM CDF (n = 24 larvae). (K) Quantification of somites with intersegmental vessels (ISVs) in 48 hpf Tg(fli1a:EGFP) embryos treated with either 0.1% DMSO (n = 47 embryos), 20 μM SM (n = 56 embryos), or CDF at 2.5 μM (n = 35 embryos), 5 μM (n = 39 embryos), or 10 μM (n = 27 embryos). CDF at 2.5 μM does not inhibit primary angiogenesis. Representative fluorescent images of graph K can be found in Figure S2A–E. (L–O’) Lateral confocal images of Tg(fli1a:nEGFP);Tg(-5.2lyve1b:DsRed2) larvae treated with either 0.1% DMSO (L,L’), 20 μM SM (M,M’), 10 μM CM (N,N’), or 2.5 μM CDF (O,O’). CDF at 2.5 μM blocks facial lymphatic development. Images (L’–O’) represent the Tg(-5.2lyve1b:DsRed2) expression of images (L–O). (P–R) Quantification of lateral facial lymphatic (LFL, P), medial facial lymphatic (MFL, Q), or otolithic lymphatic vessel (OLV, R) nuclei in 5 dpf Tg(fli1a:nEGFP);Tg(-5.2lyve1b:DsRed2) larvae treated with either 0.1% DMSO (n = 14 larvae), 20 μM SM (n = 16 larvae), 10 μM CM (n = 14 larvae), or 2.5 μM CDF (n = 15 larvae). Statistical test: Kruskal-Wallis test were conducted for graphs (E,I–K,P–R). PCV: posterior cardinal vein. p ≤ 0.001 (***) and n.s. indicates not significant. Scale bars: 100 μm. |