
- Title
-
LncRNA VEAL2 regulates PRKCB2 to modulate endothelial permeability in diabetic retinopathy
- Authors
- Sehgal, P., Mathew, S., Sivadas, A., Ray, A., Tanwar, J., Vishwakarma, S., Ranjan, G., Shamsudheen, K.V., Bhoyar, R.C., Pateria, A., Leonard, E., Lalwani, M., Vats, A., Pappuru, R.R., Tyagi, M., Jakati, S., Sengupta, S., B K, B., Chakrabarti, S., Kaur, I., Motiani, R.K., Scaria, V., Sivasubbu, S.
- Source
- Full text @ EMBO J.
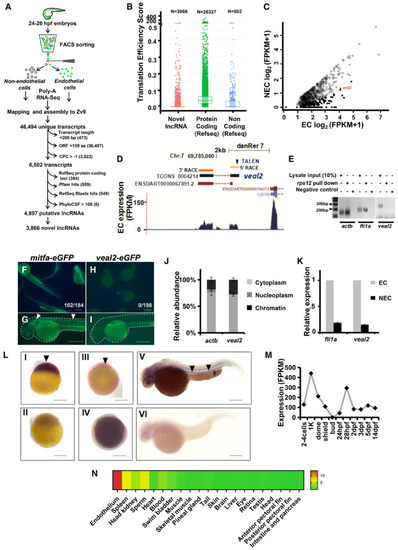
Schematic for the experimental workflow and the computational pipeline employed for the discovery and annotation of endothelium‐enriched long non‐coding RNAs. Distribution of Translation Efficiency Score (TES) across novel lncRNAs identified in this study and RefSeq genes. Box limits indicate the 25th and 75th percentiles as determined by R software; whiskers extend till 5th and 95th percentiles. Differential expression analysis revealed 156 endothelial‐enriched lncRNAs with a fold change of at least 10 (closed circles) and 685 lncRNAs at 2‐fold (open circles). UCSC browser snapshot of the zebrafish vascular endothelial‐associated lncRNA 2 ( Ribosomal pulldown shows lack of occupancy of ribosomes on e‐GFP fusion assay confirms lack of peptide formation from Relative abundance analysis from different subcellular fractions revealed Relative expression of Whole‐mount in situ expression analysis of the Expression of |
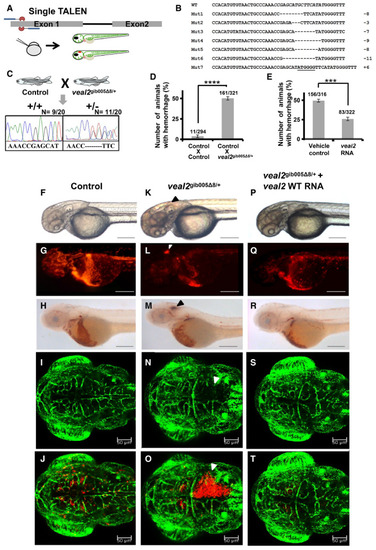
Schematic representation of TALEN design, its injection into one‐cell zebrafish embryos, and screening at 2 dpf for any phenotypic changes. List of sequences showing indels at the Schematic representation of outcross of Bar graph representing the number of animals which displayed the hemorrhage phenotype across the progeny derived from breeding of two control Bar graph representing the number of animals which displayed the hemorrhage phenotype across the progeny derived from an outcross of Representative images of 2 dpf zebrafish which displayed the rescue of the vascular integrity defects in the progeny of an outcross of Data information: All the experiments |
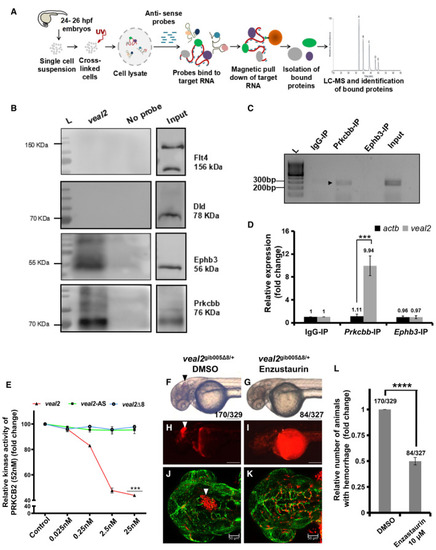
Schematic of the methodology adopted for the identification of protein interacting partners of RAP‐MS followed by Western blotting validated Prkcbb and Ephb3 as interacting protein partners with RNA immunoprecipitation of qRT–PCR‐based quantification of Relative kinase activity of human PRKCB2 under standard conditions and in the presence of various concentrations of the WT Enzastaurin treatment rescues hemorrhage phenotype in Relative number of animals that displayed the hemorrhage phenotype across the progeny of the outcross of Data information: All the experiments |
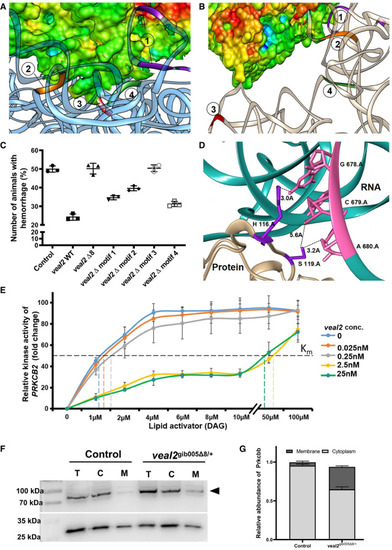
Scatter plot showing the number of animals which displayed the hemorrhage phenotype across the progeny derived from an outcross of The site of interaction of the motif‐3 of Relative kinase activity of human PRKCB2 with various concentrations of DAG without or with different concentrations of Abundance of Prkcbb protein in total cell (T), cytoplasmic (C), and membrane (M) fractions of cells from 2 dpf Relative quantification of Prkcbb localization in cytoplasmic and membrane fractions of control and Data information: All the experiments PHENOTYPE:
|
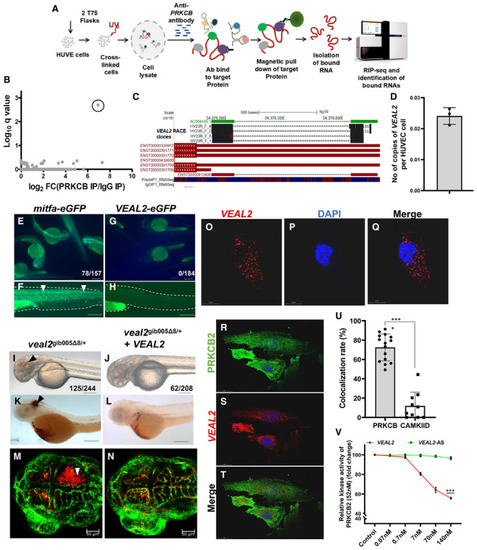
Schematic of the methodology adopted for the identification of RNA interacting partners of PRKCB in HUVECs using a RIP‐seq‐based approach. RIP‐seq of PRKCB in HUVECs identified a candidate lncRNA with significant q‐value (0.002) and high expression. Representation of genomic location of AC008440.2‐human vascular endothelial‐associated lncRNA 2 ( Absolute quantification of e‐GFP fusion assay confirms lack of peptide formation from Complementation of Single molecule FISH (smFISH) of Co‐IF for PRKCB and smFISH of Bar graph represents the colocalization rate (%) of Relative kinase activity of human PRKCB2 under standard conditions and in the presence of various concentrations of the WT Data information: All the experiments |
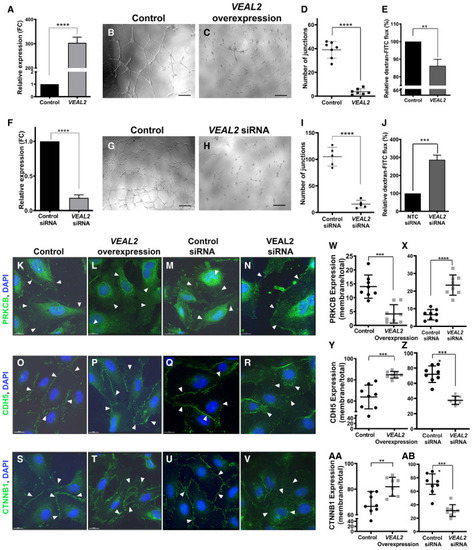
A. VEAL2 RNA levels significantly increased upon overexpression of VEAL2 plasmid compared to control. Bar graph representing relative expression of VEAL2 in control pcDNA3.1 plasmid (1 μg) and VEAL2 in pcDNA3.1 plasmid (1 μg) for overexpression in HUVECs. GAPDH was taken as normalization control. Data are acquired from 3 different biological replicates and shown as mean fold change values ± standard deviation. B–D. Overexpression of VEAL2 in HUVECs displayed massive reduction in tube formation in Matrigel compared to control. (B, C) Magnification-5× and scale bar-50 μm. (D) Dot plot representing quantification of number of junctions formed between the vessels in control cells and VEAL2-overexpressed cells grown on Matrigel. Data from different fields of 4 different technical replicates of 1 biological replicate are represented. Data are shown as individual values; the middle bar represents the mean, and the error bar represents ± standard deviation. E. Overexpression of VEAL2 significantly changes efflux of dextran-conjugated FITC measuring permeability levels. Bar graph representing relative quantification of efflux of dextran-conjugated FITC measuring permeability levels in control and VEAL2-overexpressed HUVECs. Data obtained from 3 different biological replicates and plotted as mean percentage fold change values ± standard deviation. F. siRNA-mediated knockdown of VEAL2 significantly reduces expression of VEAL2 in HUVECs. Bar graph representing relative expression of VEAL2 in control siRNA and VEAL2 targeting siRNA-transfected HUVECs. Data are acquired from 3 different biological replicates and shown as mean fold change values ± standard deviation. G–I. Knockdown of VEAL2 significantly reduced tube formation in Matrigel. (G–H) Magnification-5× and scale bar-50 μm. (I) Dot plot representing quantification of number of junctions formed between the vessels in control siRNA and VEAL2 targeting siRNA-treated HUVECs. The HUVECs were grown on Matrigel. Data from different fields of 4 different technical replicates of 1 biological replicate are represented. Data are shown as individual values; the middle bar represents the mean, and the error bar represents ± standard deviation. J. siRNA-mediated knockdown of VEAL2 significantly changes efflux of dextran-conjugated FITC measuring permeability levels. Bar graph representing relative quantification of efflux of dextran conjugated FITC for measuring permeability levels in control siRNA- and VEAL2 siRNA-transfected HUVECs. Data obtained from 3 different biological replicates and plotted as mean percentage fold change values ± standard deviation. K–AB. VEAL2 regulates junctional dynamics by interacting with PRKCB. Overexpression of VEAL2 retains PRKCB mostly in cytoplasm and keeps strong junctional assembly formation of CDH5 and CTNNB1 on the membrane. Knockdown of VEAL2 led to migration of PRKCB on membrane and henceforth degradation of junctional assembly of CDH5 and CTNNB1. (K–N, W–X) PRKCB. (O–R, Y–Z) CDH5. (S–V, AA–AB) CTNNB1. (K–V) Magnification-60× and scale bar-15 μm. Arrowheads indicate representation of signals of proteins in HUVECs. (W–AB) Dot plot representing quantification of protein signal localization in membrane/total fraction. The quantification was done using ImageJ. Data from cells of different fields of 3 technical replicates of 1 biological replicate are presented as representation. Data are shown as individual values; the middle bar represents the mean, and the error bar represents ± standard deviation. |
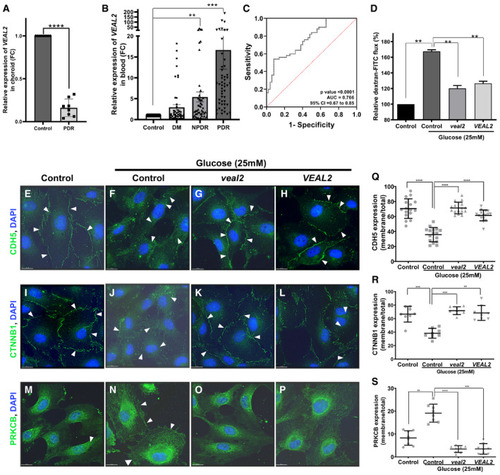
Bar graph representing relative expression of Bar graph representing relative fold change of ROC curve shows sensitivity and specificity of Complementation of Modeling hyperglycemia in HUVEC resulted in dysregulation of junctional assembly of CDH5 and CTNNB1 proteins and increased membrane localization of PRKCB protein. Complementation of Data information: All the experiments |
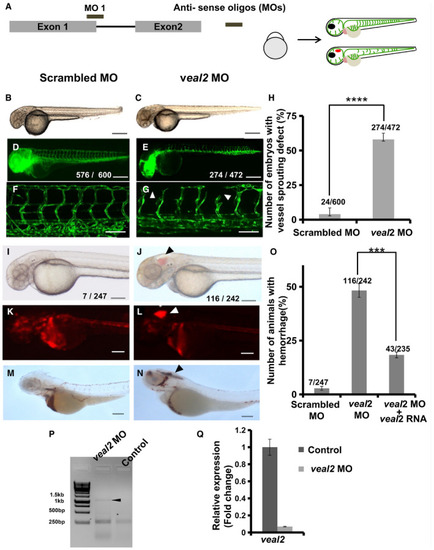
Schema representing the design of splice‐block morpholino on Representative images of morpholino‐injected zebrafish at 2 dpf under bright field and EGFP filter. (B, D, F) Embryos injected with scrambled morpholinos. (C, E, G) Embryos injected with the Bar graph representing a number of animals displaying vascular sprouting defects in Representative images of morpholino‐injected 2 dpf zebrafish under bright field, mRFP filter and animals stained with O‐dianisidine. (I, K, M) Embryos injected with non‐targeting control (NTC) morpholino. (J, L, N) Embryos injected with the Percentage of animals that showed vascular integrity defects at 2 dpf when injected with 3 nl of 500 μM scrambled morpholino, 500 μM Gel represents the PCR‐amplified products using primers designed across the intron. The arrowhead indicates the product with retention of the intron due to the effect of morpholino. Relative expression of Data information: All the experiments |
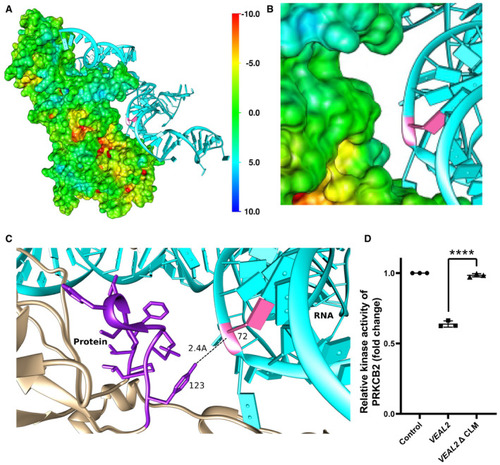
Representation of interaction of The 3 bases of motif‐3 (CLM) in Relative kinase activity of human PRKCB2 under standard conditions and in the presence of various variants of Data information: All the experiments |
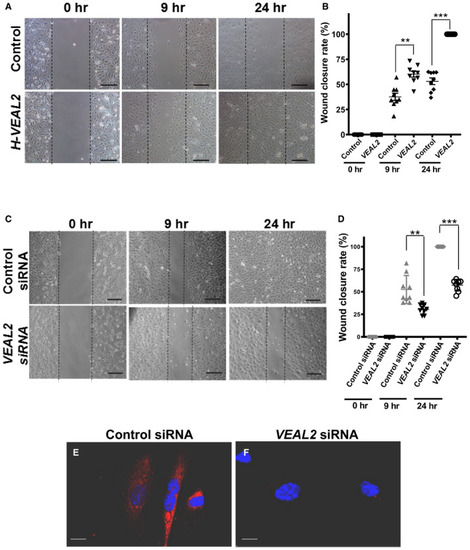
Representative images showing wound closure rate in overexpressed Dot plot representing wound closure rate at 0, 9, and 24 h post‐scratch in control cells and Representative images showing wound closure rate in control siRNA‐ and Dot plot representing wound closure rate at initial time, 9, and 24 h post‐scratch in control siRNA‐ and smFISH of Data information: All the experiments |
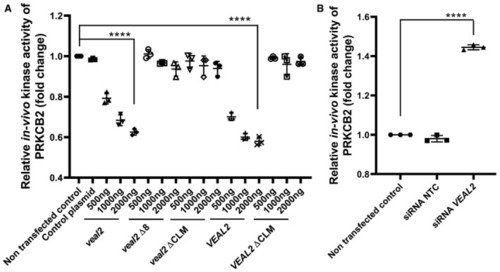
Dot plot representing endogenous kinase activity of human PRKCB2 in HUVECs under standard conditions and upon overexpression of various variants of Dot plot representing endogenous kinase activity of human PRKCB2 in HUVECs under standard conditions and upon knockdown of Data information: All the experiments |
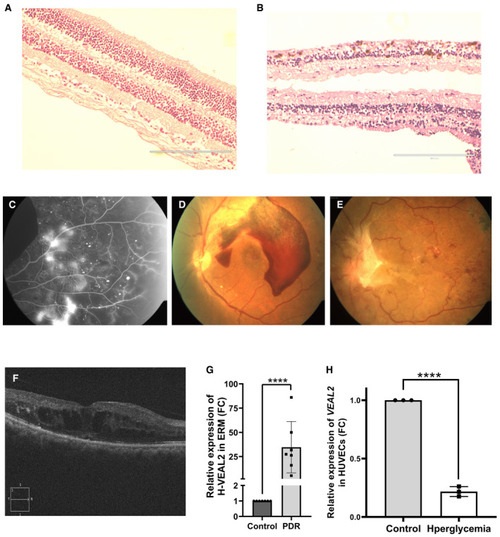
H&E‐based immunohistochemistry of retina indicating symptoms of diabetic retinopathy (DR). (A) Retina of control sample indicating regular retinal structures with proper cellular organization. (B) Retina samples of DM patients highlighted early symptoms of retinopathy in form of degeneration of ganglion layer, microaneurysm, arteriolar dilatation, and mild edema. Scale bar is 200 μm. Retina scan of patients highlighting symptoms of retinopathy. (C) Fundus fluorescence angiography of patients showing vessel integrity defects. (D) Fundus photograph of a patient with symptoms of proliferative diabetic retinopathy and having subhyaloid hemorrhages. (E) Fundus photograph of a patient with symptoms of proliferative diabetic retinopathy with fibrovascular proliferation at disk and abnormal new blood vessels (NVE). (F) Optical coherence tomography of patients with diabetic macular edema. Dot plot representing relative expression of Bar graph representing relative expression of Data information: All the experiments |
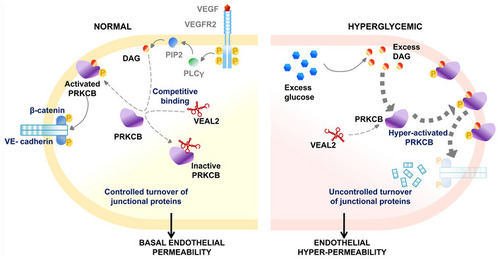
Hypothetical schema showing normal endothelial cell (left), in which the apparent competitive binding of DAG and |