Poly‐A RNA sequencing reveals endothelial‐associated lncRNome in zebrafish
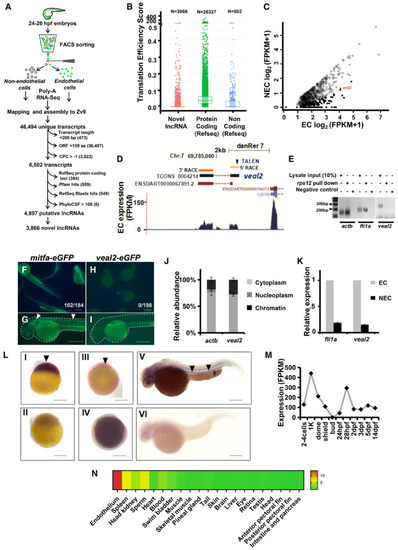
Schematic for the experimental workflow and the computational pipeline employed for the discovery and annotation of endothelium‐enriched long non‐coding RNAs.
Distribution of Translation Efficiency Score (TES) across novel lncRNAs identified in this study and RefSeq genes. Box limits indicate the 25th and 75th percentiles as determined by R software; whiskers extend till 5th and 95th percentiles.
Differential expression analysis revealed 156 endothelial‐enriched lncRNAs with a fold change of at least 10 (closed circles) and 685 lncRNAs at 2‐fold (open circles).
UCSC browser snapshot of the zebrafish vascular endothelial‐associated lncRNA 2 (veal2) transcript. 5’ RACE and 3’ RACE data confirmed ends of the veal2 transcript.
Ribosomal pulldown shows lack of occupancy of ribosomes on veal2. fli1a and actb were used as positive controls.
e‐GFP fusion assay confirms lack of peptide formation from veal2 sequence. (F–G) mitfa‐eGFP fused transcript. (H–I) veal2‐eGFP fused transcript. Arrowheads indicating e‐GFP expression in mitfa‐eGFP‐injected embryos. Scale bar‐100μm.
Relative abundance analysis from different subcellular fractions revealed veal2 is a cytoplasmic lncRNA. Bar graph represents the relative abundance of veal2 and actb transcripts across different fractions of the cell. Data from three different experiments plotted as mean percentage values ± standard deviation.
Relative expression of veal2 across fluorescence‐activated cell sorted (FACS) GFP(+) endothelial cells (EC) and GFP(‐) non‐endothelial cells (NEC). fli1a and actb were taken as positive control and normalization control, respectively. Data from three different experiments represented as fold change relative to EC values ± standard deviation.
Whole‐mount in situ expression analysis of the veal2 transcript across different stages of zebrafish embryos. (LI,II) 1K cell stage, (LIII,IV) 10 hpf stage, and (LV,IV) 28 hpf stage. LI,III,V‐Anti‐sense‐veal2 probe. (LII,IV,VI) Sense‐veal2 probe. Magnification‐2.5X and scale bars‐100μm.
Expression of veal2 transcript (FPKM scores) across (M) 11 developmental stages and (N) all publically available RNA‐seq data of zebrafish’s different tissues or cell types compiled by ZFLNC database (Hu et al, 2018).
This image is the copyrighted work of the attributed author or publisher, and
ZFIN has permission only to display this image to its users.
Additional permissions should be obtained from the applicable author or publisher of the image.
Full text @ EMBO J.
Your Input Welcome
Thank you for submitting comments. Your input has been emailed to ZFIN curators who may contact you if
additional information is required.
Oops. Something went wrong. Please try again later.