
|
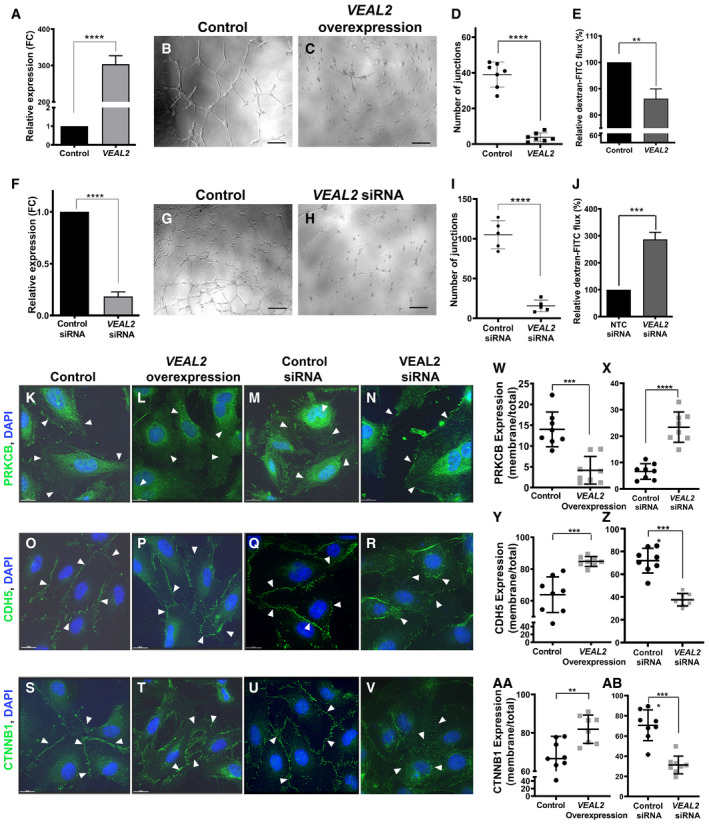
Fig. 6 A. VEAL2 RNA levels significantly increased upon overexpression of VEAL2 plasmid compared to control. Bar graph representing relative expression of VEAL2 in control pcDNA3.1 plasmid (1 μg) and VEAL2 in pcDNA3.1 plasmid (1 μg) for overexpression in HUVECs. GAPDH was taken as normalization control. Data are acquired from 3 different biological replicates and shown as mean fold change values ± standard deviation. B–D. Overexpression of VEAL2 in HUVECs displayed massive reduction in tube formation in Matrigel compared to control. (B, C) Magnification-5× and scale bar-50 μm. (D) Dot plot representing quantification of number of junctions formed between the vessels in control cells and VEAL2-overexpressed cells grown on Matrigel. Data from different fields of 4 different technical replicates of 1 biological replicate are represented. Data are shown as individual values; the middle bar represents the mean, and the error bar represents ± standard deviation. E. Overexpression of VEAL2 significantly changes efflux of dextran-conjugated FITC measuring permeability levels. Bar graph representing relative quantification of efflux of dextran-conjugated FITC measuring permeability levels in control and VEAL2-overexpressed HUVECs. Data obtained from 3 different biological replicates and plotted as mean percentage fold change values ± standard deviation. F. siRNA-mediated knockdown of VEAL2 significantly reduces expression of VEAL2 in HUVECs. Bar graph representing relative expression of VEAL2 in control siRNA and VEAL2 targeting siRNA-transfected HUVECs. Data are acquired from 3 different biological replicates and shown as mean fold change values ± standard deviation. G–I. Knockdown of VEAL2 significantly reduced tube formation in Matrigel. (G–H) Magnification-5× and scale bar-50 μm. (I) Dot plot representing quantification of number of junctions formed between the vessels in control siRNA and VEAL2 targeting siRNA-treated HUVECs. The HUVECs were grown on Matrigel. Data from different fields of 4 different technical replicates of 1 biological replicate are represented. Data are shown as individual values; the middle bar represents the mean, and the error bar represents ± standard deviation. J. siRNA-mediated knockdown of VEAL2 significantly changes efflux of dextran-conjugated FITC measuring permeability levels. Bar graph representing relative quantification of efflux of dextran conjugated FITC for measuring permeability levels in control siRNA- and VEAL2 siRNA-transfected HUVECs. Data obtained from 3 different biological replicates and plotted as mean percentage fold change values ± standard deviation. K–AB. VEAL2 regulates junctional dynamics by interacting with PRKCB. Overexpression of VEAL2 retains PRKCB mostly in cytoplasm and keeps strong junctional assembly formation of CDH5 and CTNNB1 on the membrane. Knockdown of VEAL2 led to migration of PRKCB on membrane and henceforth degradation of junctional assembly of CDH5 and CTNNB1. (K–N, W–X) PRKCB. (O–R, Y–Z) CDH5. (S–V, AA–AB) CTNNB1. (K–V) Magnification-60× and scale bar-15 μm. Arrowheads indicate representation of signals of proteins in HUVECs. (W–AB) Dot plot representing quantification of protein signal localization in membrane/total fraction. The quantification was done using ImageJ. Data from cells of different fields of 3 technical replicates of 1 biological replicate are presented as representation. Data are shown as individual values; the middle bar represents the mean, and the error bar represents ± standard deviation.