IMAGE

Fig. 4

ID
ZDB-IMAGE-210817-22
Source
Figures for Sehgal et al., 2021
Image
Figure Caption

Fig. 4 <italic toggle='yes'>veal2</italic> interacts with DAG‐binding C1 domain of Prkcbb protein and regulates kinase activation

In silico docking of veal2 and Prkcbb identified putative 4 interaction motifs in veal2. Motif‐1(549, 551‐553, 559, 560) in purple, motif‐2(584‐587) in orange, motif‐3(678–680) in red, and motif‐4(844–846) in green. The 8bp deletion in veal2‐Δ8 RNA led to change in folding and altered interaction with Prkcbb.

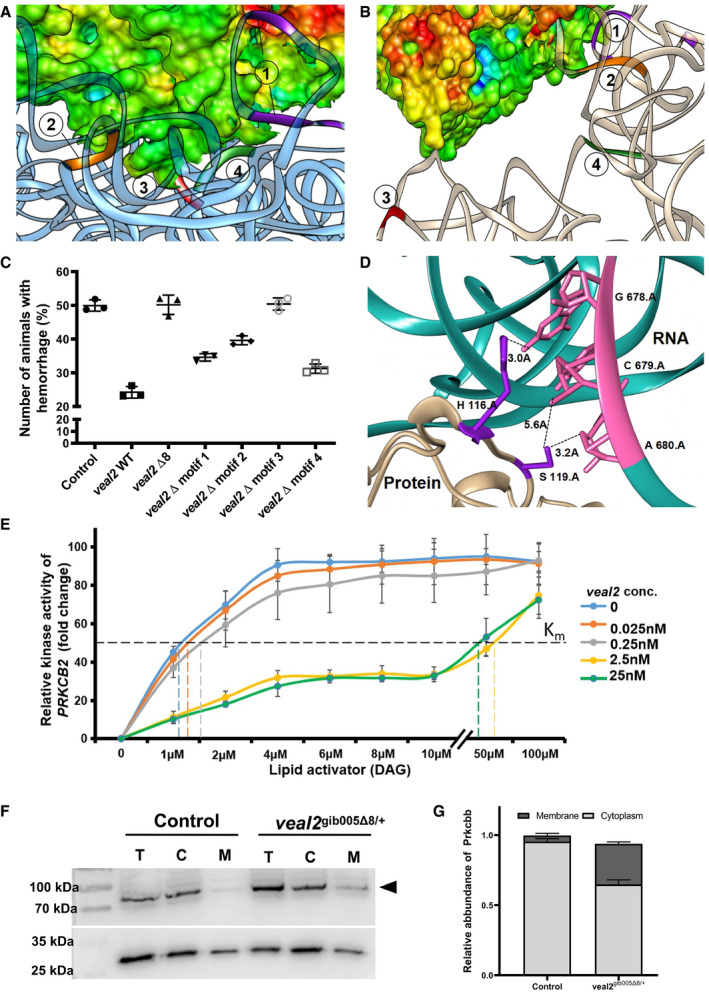
Scatter plot showing the number of animals which displayed the hemorrhage phenotype across the progeny derived from an outcross of veal2gib005Δ8/+ zebrafish injected with IVTs of different veal2 variants. Control indicates veal2gib005Δ8/+ zebrafish without complementation. Data from three different experiments plotted as individual values; the middle bar represents mean percentage, and the error bar represents ± standard deviation.

The site of interaction of the motif‐3 of veal2 (CLM) with the Prkcbb protein indicates that it lies in a previously known DAG‐binding site. Both RNA (pink) and protein (purple) structures are shown as ribbon models. The distances between nucleotides of motif‐3 of veal2 and the 2 amino acids of Prkcbb are given in Å units.

Relative kinase activity of human PRKCB2 with various concentrations of DAG without or with different concentrations of veal2 WT RNA (0, 0.025, 0.25, 2.5, 25 nM). PRKCB2 activity without DAG was used for normalization. Data from three different experiments plotted as mean fold change values ± standard deviation.

Abundance of Prkcbb protein in total cell (T), cytoplasmic (C), and membrane (M) fractions of cells from 2 dpf gib004Tg(fli1a:EGFP;gata1a:DsRed) and veal2gib005Δ8/+ zebrafish embryos. Arrowhead indicates Prkcbb enrichment in the membrane fraction of veal2gib005Δ8/+ zebrafish embryos.

Relative quantification of Prkcbb localization in cytoplasmic and membrane fractions of control and veal2gib005Δ8/+ embryos. Data from three different experiments plotted as mean percentage values ± standard deviation.

Data information: All the experiments N ≥ 3.

Source data are available online for this figure.

Acknowledgments
This image is the copyrighted work of the attributed author or publisher, and ZFIN has permission only to display this image to its users. Additional permissions should be obtained from the applicable author or publisher of the image. Full text @ EMBO J.