
- Title
-
Inhibition of endoplasmic reticulum stress-related autophagy attenuates MCLR-induced apoptosis in zebrafish testis and mouse TM4 cells
- Authors
- Wu, Z., Wang, F., Hu, L., Zhang, J., Chen, D., Zhao, S.
- Source
- Full text @ Ecotoxicol. Environ. Saf.
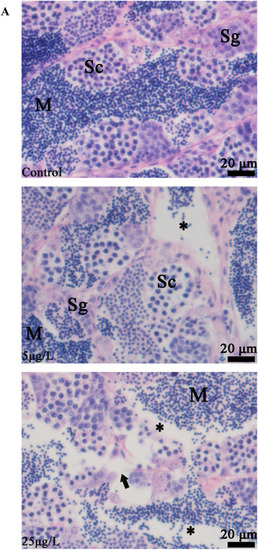
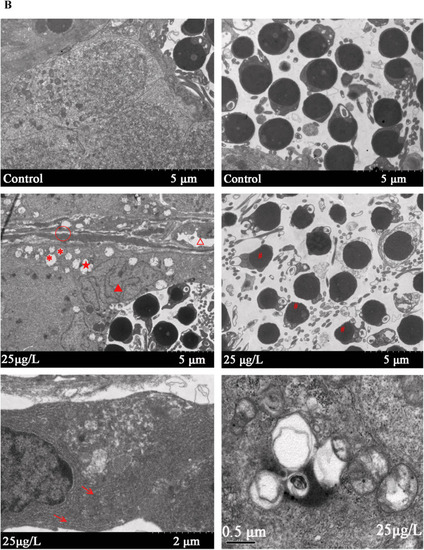
Effects of MCLR induced pathohistological damage in zebrafish testes. (A) Histopathological changes in the testes of male zebrafish after exposed to MCLR for 30 days. M: mature sperm, Sc: spermatocyte, Sg: spermatogonia; widen interstitial space (arrow), cellular vacuolation (*). The scale bars: 20 µm.(B)The ultrastructure of zebrafish testis were observed by transmission electron microscope. Swollen mitochondria (*); Vacuoles (△); autophagic vacuoles (★); nuclear heterogeneity (▲); hyperplasia of endoplasmic reticulum associated with mild expansion (arrow); Compared with the control group, the intercellular space was increased significantly (○) and the sperm morphology is obviously abnormal (#). PHENOTYPE:
|
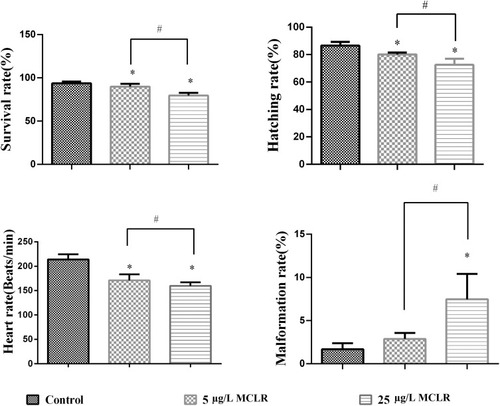
Effects of different concentrations of MCLR on the heart rate, malformation survival rate and hatching rate in offspring larave (n = 30 per group). *P < 0.05 significantly different from control group. #P < 0.05 significantly different between different MCLR groups. PHENOTYPE:
|
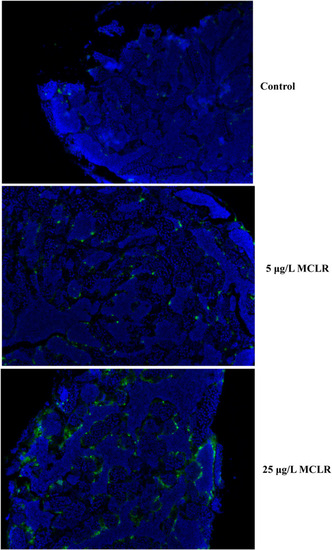
Apoptosis assessed by TUNEL staining in zebrafish testis. Green fluorescences indicated TUNEL-positive apoptotic cells. PHENOTYPE:
|

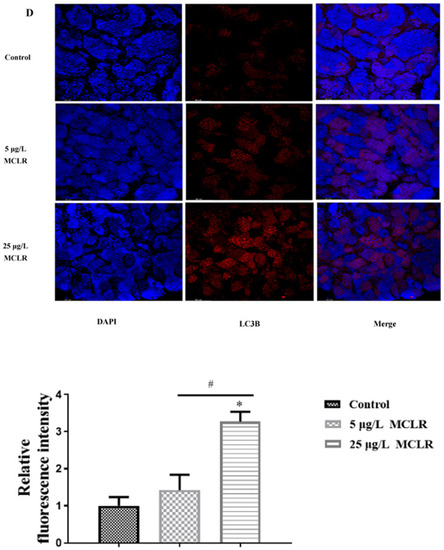
(A) The GRP78 expression levels were normalized with GAPDH expression in zebrafish testes (n = 3). (B) Expression profiles of the autophagy-related genes in the testes of zebrafish exposed to MCLR (n = 4). (C) ATG5, ATG12, LC3BⅠ and LC3BⅡ in the testes of zebrafish were examined by western blotting (n = 3). (D) Representative immunofluorescence pictures and quantified data to detect LC3B levels in control and MCLR-treated zebrafish testes. Scale bar: 50 µm. * P < 0.05 significantly different from vehicle control group. #P < 0.05 significantly different between different MCLR groups. |
(A) The GRP78 expression levels were normalized with GAPDH expression in zebrafish testes (n = 3). (B) Expression profiles of the autophagy-related genes in the testes of zebrafish exposed to MCLR (n = 4). (C) ATG5, ATG12, LC3BⅠ and LC3BⅡ in the testes of zebrafish were examined by western blotting (n = 3). (D) Representative immunofluorescence pictures and quantified data to detect LC3B levels in control and MCLR-treated zebrafish testes. Scale bar: 50 µm. * P < 0.05 significantly different from vehicle control group. #P < 0.05 significantly different between different MCLR groups. |

ZFIN is incorporating published figure images and captions as part of an ongoing project. Figures from some publications have not yet been curated, or are not available for display because of copyright restrictions. |
|
ZFIN is incorporating published figure images and captions as part of an ongoing project. Figures from some publications have not yet been curated, or are not available for display because of copyright restrictions. |

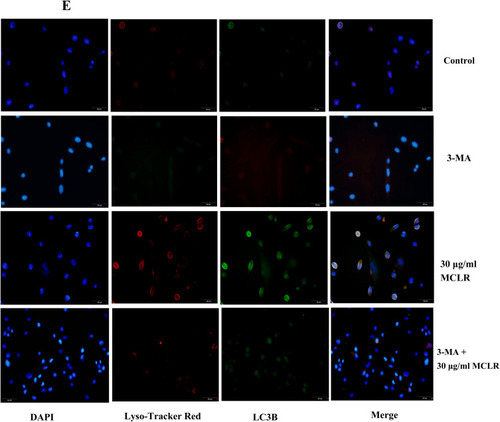
MCLR activates ER stress and autophagy in TM4 cells. (A) Representative immunoblots showed GRP78 proteins after different treatment. GAPDH was used as the control. Relative protein levels of GRP78 were shown from 4 independent experiments. (B) The mRNA expression of grp78 were evaluated by qRT-PCR (n = 4). (C) The mRNA expression of autophagy related genes atg5, atg12 and lc3b were evaluated by qRT-PCR (n = 4). (D) The expression levels of the autophagy markers ATG5, ATG12, LC3BⅠ and LC3BⅡ were analyzed by Western blot (n = 3). (E) Cell imaging was performed to analyze the colocalization of LysoTracker-stained acidified vesicles and LC3b-positive autophagosomes in control and MCLR-treated cells. Scale bar: 50 µm. *P < 0.05 significantly different from control group. ^P < 0.05 significantly different from 7.5 μg/mL MCLR. ▲P < 0.05 significantly different from 30 μg/mL MCLR. |

MCLR activates ER stress and autophagy in TM4 cells. (A) Representative immunoblots showed GRP78 proteins after different treatment. GAPDH was used as the control. Relative protein levels of GRP78 were shown from 4 independent experiments. (B) The mRNA expression of grp78 were evaluated by qRT-PCR (n = 4). (C) The mRNA expression of autophagy related genes atg5, atg12 and lc3b were evaluated by qRT-PCR (n = 4). (D) The expression levels of the autophagy markers ATG5, ATG12, LC3BⅠ and LC3BⅡ were analyzed by Western blot (n = 3). (E) Cell imaging was performed to analyze the colocalization of LysoTracker-stained acidified vesicles and LC3b-positive autophagosomes in control and MCLR-treated cells. Scale bar: 50 µm. *P < 0.05 significantly different from control group. ^P < 0.05 significantly different from 7.5 μg/mL MCLR. ▲P < 0.05 significantly different from 30 μg/mL MCLR. |
MCLR activates ER stress and autophagy in TM4 cells. (A) Representative immunoblots showed GRP78 proteins after different treatment. GAPDH was used as the control. Relative protein levels of GRP78 were shown from 4 independent experiments. (B) The mRNA expression of grp78 were evaluated by qRT-PCR (n = 4). (C) The mRNA expression of autophagy related genes atg5, atg12 and lc3b were evaluated by qRT-PCR (n = 4). (D) The expression levels of the autophagy markers ATG5, ATG12, LC3BⅠ and LC3BⅡ were analyzed by Western blot (n = 3). (E) Cell imaging was performed to analyze the colocalization of LysoTracker-stained acidified vesicles and LC3b-positive autophagosomes in control and MCLR-treated cells. Scale bar: 50 µm. *P < 0.05 significantly different from control group. ^P < 0.05 significantly different from 7.5 μg/mL MCLR. ▲P < 0.05 significantly different from 30 μg/mL MCLR. |
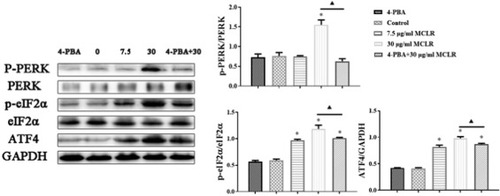
The bands of PERK, p-PERK, eIF2α, p-IF2α, ATF4 and GAPDH expression levels measured by using Western blotting assay in TM4 cells (n = 3). * P < 0.05 significantly different from control group. ▲P < 0.05 significantly different from 30 μg/mL MCLR. |
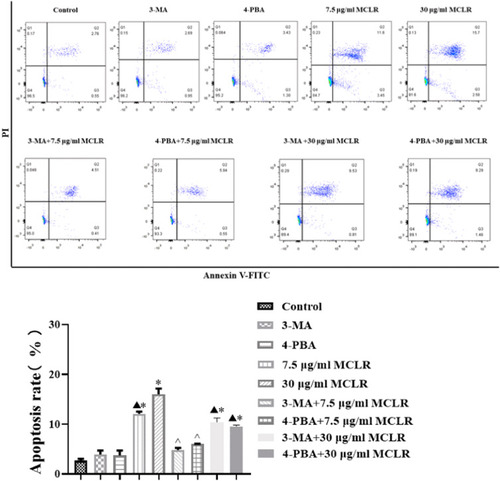
Apoptosis rate of TM4 cells after different treatment was detected by flow cytometry (n = 3 per group). * P < 0.05 significantly different from control group. ^P < 0.05 significantly different from 7.5 μg/mL MCLR. ▲P < 0.05 significantly different from 30 μg/mL MCLR. |