
Image
|
Figure Caption
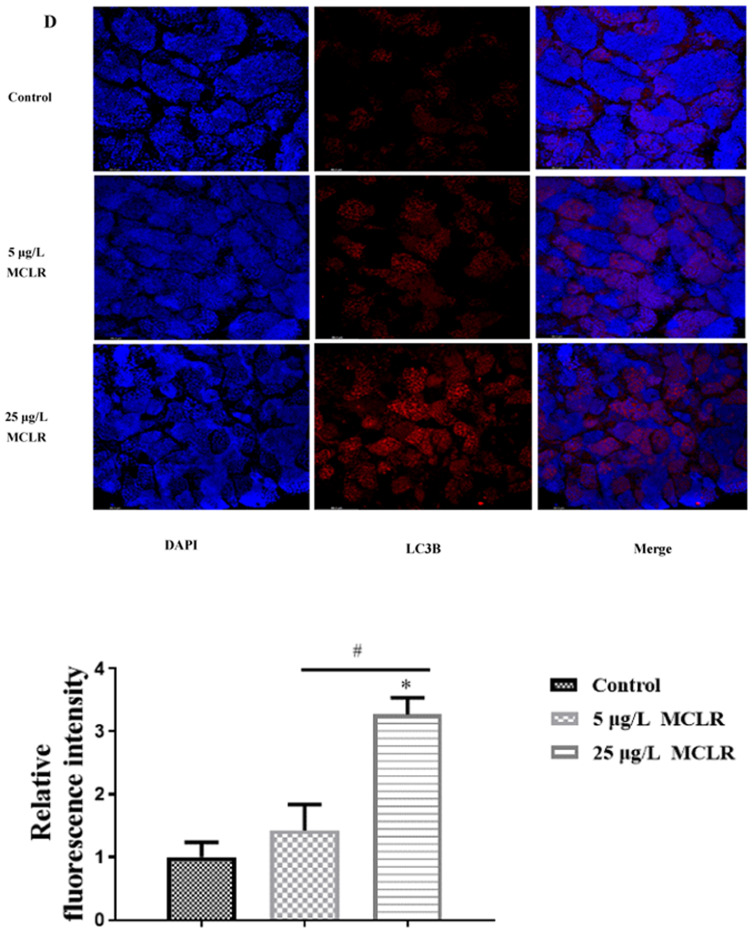
Fig. 4B (A) The GRP78 expression levels were normalized with GAPDH expression in zebrafish testes (n = 3). (B) Expression profiles of the autophagy-related genes in the testes of zebrafish exposed to MCLR (n = 4). (C) ATG5, ATG12, LC3BⅠ and LC3BⅡ in the testes of zebrafish were examined by western blotting (n = 3). (D) Representative immunofluorescence pictures and quantified data to detect LC3B levels in control and MCLR-treated zebrafish testes. Scale bar: 50 µm. * P < 0.05 significantly different from vehicle control group. #P < 0.05 significantly different between different MCLR groups.
Figure Data
Acknowledgments
This image is the copyrighted work of the attributed author or publisher, and
ZFIN has permission only to display this image to its users.
Additional permissions should be obtained from the applicable author or publisher of the image.
Full text @ Ecotoxicol. Environ. Saf.