
- Title
-
In vivo calcium imaging reveals disordered interictal network dynamics in epileptic stxbp1b zebrafish
- Authors
- Liu, J., Salvati, K.A., Baraban, S.C.
- Source
- Full text @ iScience
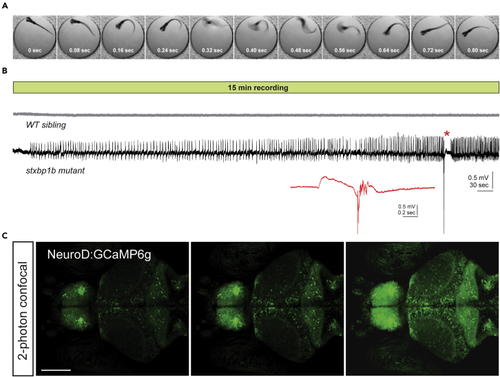
Characterization of epileptic phenotype in (A) Representative spontaneous high-velocity convulsive behavior captured during high-speed imaging (250 fps) of a single (B) Representative 15 min local field potential recordings from randomly selected larvae from a cross of (C) Confocal images taken with a 2-photon microscope of a representative |
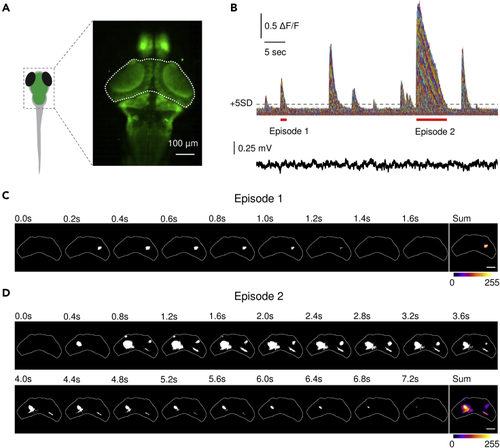
Measuring cascades in zebrafish optic tectum (A) Calcium imaging in (B) Calcium traces (ΔF/F) from pixels within the optic tectum in a (C and D) Binarized activity from episodes indicated in (B) (underlined in red). One normal cascade was revealed in (C), and multiple cascades were revealed in (D), including an abnormally large and long cascade located in the left optic tectum. The last frame represents the summation of the binary time series stack of the corresponding episode showing the spatial mapping of the cascades. The cumulative intensity of activation is color coded as shown in the color bar. Scale bars, 100 μm. PHENOTYPE:
|
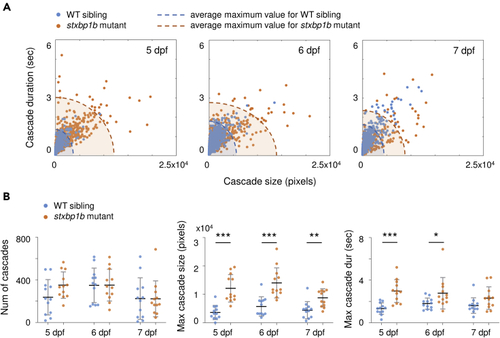
Cascade quantification (A) Cascade size versus duration on different days post fertilization (dpf). Blue dots represent WT siblings, and orange dots represent (B) Probability distribution of cascade sizes on different dpf. The plots show the cumulative distributions of the corresponding data (blue, WT siblings; orange, |
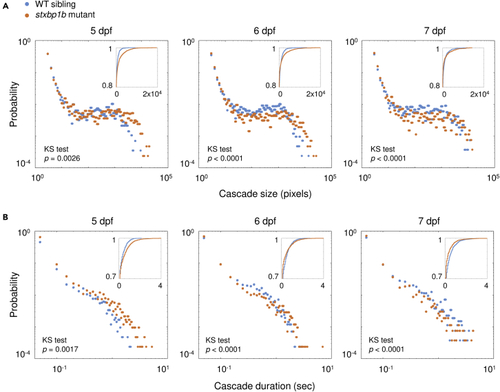
Probability distribution of cascade size and duration (A) Probability distribution of cascade sizes on different days post fertilization (dpf). The insert plots show the cumulative distributions of the corresponding data (blue, WT siblings; orange, stxbp1b mutants). (B) Probability distribution of cascade durations on different dpf. p values of KS tests are indicated in figure. Data from 12 fish per day for each condition is plotted. |
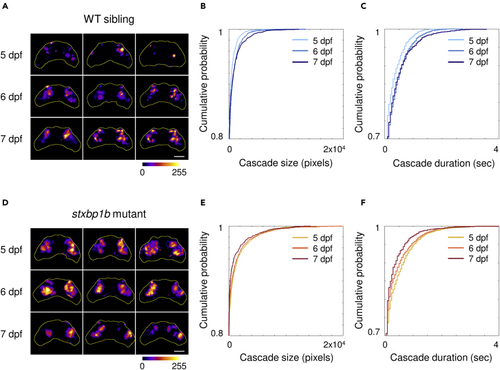
Cumulative distribution of cascade size and duration (A) Representative stack summation of binary time series from WT siblings on different days post fertilization (dpf). Each tile represents one fish. The cumulative intensity of activation is color coded as shown in the color bar. (B) Cumulative distribution of cascade sizes and durations from WT siblings on different dpf (light blue, 5 dpf; blue, 6 dpf; dark blue, 7 dpf). (C) Representative time series stack summation from (D) Cumulative distribution of cascade sizes and durations from |
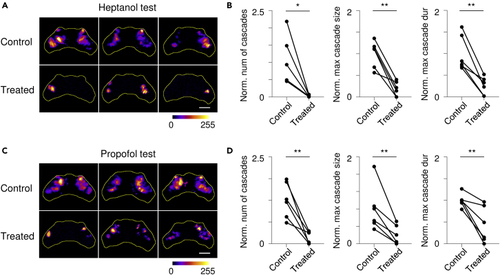
Gap junction blockers reduce neuronal cascade intensity (A) Representative stack summation of binary time series from (B) Comparison of normalized (norm.) number (num) of cascade, maximum (max) cascade size, and maximum cascade duration (dur) before and after heptanol treatment. Data were normalized to the average value from recordings before drug treatment. (C and D) Results from propofol experiments on |
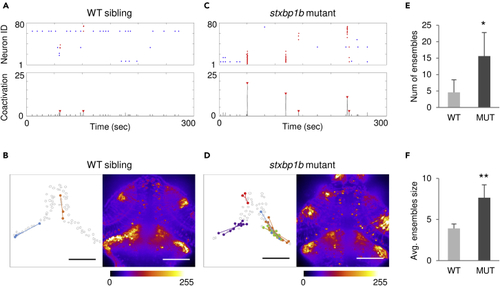
Neuronal ensembles revealed in (A) Representative neuron activation raster plot (top; red dots, ensemble neurons) and number of coactive neurons (bottom; ensembles were indicated by red arrow) from a WT sibling. (B) Left, spatial mapping of neuronal ensembles depicted in (A). Dots in the same color represent coactive neurons, and lines are distances from ensemble neurons to the corresponding ensemble centroid. Each ensemble is indicated by a color. Right, stack summation of calcium activity time series. The fluorescence intensity is color coded as shown in the color bar. (C and D) Representative data from a (E) Comparison of number (num) of ensembles. (F) Comparison of average (avg.) ensemble size. Scale bars, 100 μm. n = 5 fish each condition: for WT, 3, 1, and 1 fish from 5, 6, and 7 dpf, respectively; for mutants, 2, 2, and 1 fish from 5, 6, and 7 dpf, respectively. Data are represented as mean ± SD. Statistical significance is indicated as |