
Image
|
Figure Caption
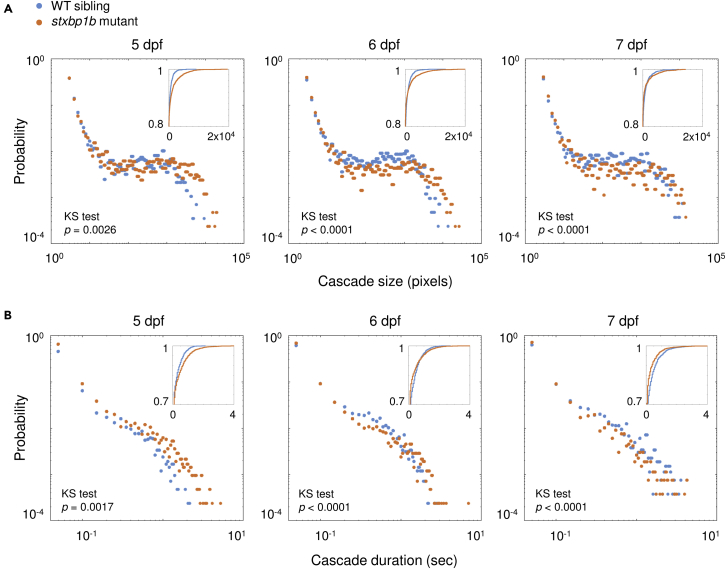
Figure 4
Probability distribution of cascade size and duration
(A) Probability distribution of cascade sizes on different days post fertilization (dpf). The insert plots show the cumulative distributions of the corresponding data (blue, WT siblings; orange, stxbp1b mutants).
(B) Probability distribution of cascade durations on different dpf. p values of KS tests are indicated in figure. Data from 12 fish per day for each condition is plotted.
Acknowledgments
This image is the copyrighted work of the attributed author or publisher, and
ZFIN has permission only to display this image to its users.
Additional permissions should be obtained from the applicable author or publisher of the image.
Full text @ iScience