
|
Figure 7
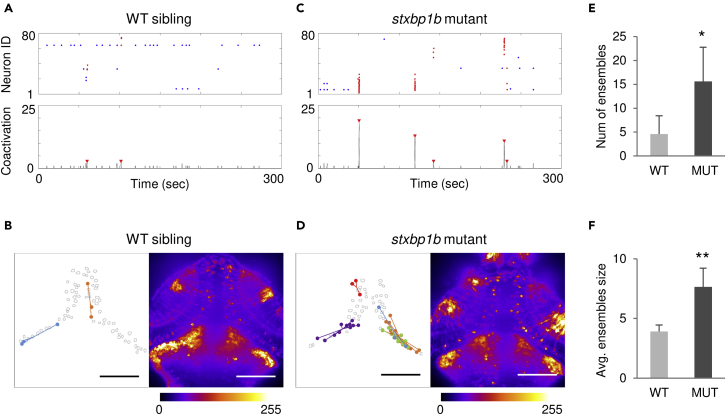
Neuronal ensembles revealed in
(A) Representative neuron activation raster plot (top; red dots, ensemble neurons) and number of coactive neurons (bottom; ensembles were indicated by red arrow) from a WT sibling. (B) Left, spatial mapping of neuronal ensembles depicted in (A). Dots in the same color represent coactive neurons, and lines are distances from ensemble neurons to the corresponding ensemble centroid. Each ensemble is indicated by a color. Right, stack summation of calcium activity time series. The fluorescence intensity is color coded as shown in the color bar.
(C and D) Representative data from a
(E) Comparison of number (num) of ensembles.
(F) Comparison of average (avg.) ensemble size. Scale bars, 100 μm. n = 5 fish each condition: for WT, 3, 1, and 1 fish from 5, 6, and 7 dpf, respectively; for mutants, 2, 2, and 1 fish from 5, 6, and 7 dpf, respectively. Data are represented as mean ± SD. Statistical significance is indicated as