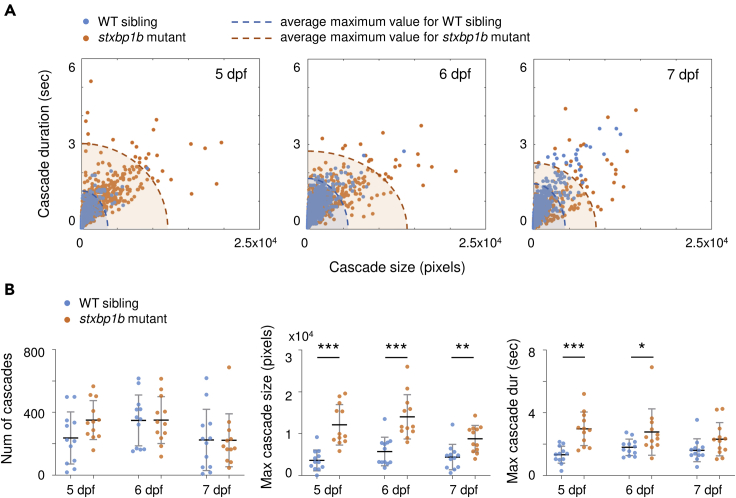
IMAGE

Figure 3

ID
ZDB-IMAGE-210623-44
Source
Figures for Liu et al., 2021
Image
Figure Caption

Figure 3

Cascade quantification

(A) Cascade size versus duration on different days post fertilization (dpf). Blue dots represent WT siblings, and orange dots represent stxbp1b mutants. Dashed lines are the ellipse contour of the average maximum value of cascade size and duration (blue, WT siblings; orange, stxbp1b mutants). For WT siblings, n = 2843, 4188, and 2690 cascades on 5, 6, and 7 dpf, respectively. For stxbp1b mutants, n = 4212, 4214, and 2668 cascades on 5, 6, and 7 dpf, respectively. Data from 12 fish per day for each condition is plotted.

(B) Probability distribution of cascade sizes on different dpf. The plots show the cumulative distributions of the corresponding data (blue, WT siblings; orange, stxbp1b mutants) on different dpf. Measurement of the number of cascade, maximum cascade size, and maximum cascade duration (per 5 min recording) on different dpf is shown. n = 12 fish per day for each condition. Data are represented as mean ± SD. Statistical significance is indicated as p < 0.05, ∗∗p < 0.01, ∗∗∗p < 0.001; Student's t test.

Figure Data
Acknowledgments
This image is the copyrighted work of the attributed author or publisher, and ZFIN has permission only to display this image to its users. Additional permissions should be obtained from the applicable author or publisher of the image. Full text @ iScience