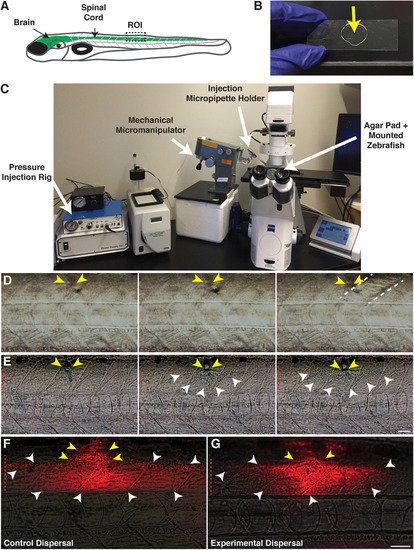
Focal delivery of solutions into the zebrafish spinal cord. (A) Cartoon of a zebrafish larvae identifying the brain and spinal cord (green). The boxed region identifies the injection site/targeted region of interest (ROI). (B) An agar pad (arrow) solidified on a borosilicate glass coverslip is used as a mounting platform for larvae to perform spinal cord injections. (C) An agar pad containing mounted larvae is placed on a microscope stage, equipped with a pressure injection rig and mechanical micromanipulator to hold the injection micropipette. (D) Muscle injections are identified by a wavy appearance following dispersal of the injection solution. Yellow arrows identify the injection site. Dotted lines denote the muscle segment injected. (E) Solutions remain localized within the spinal cord following a successful spinal cord injection. Yellow arrows identify the injection site in the dorsal spinal cord. White arrowheads identify the solution dispersal region. (F) Dispersal region of a control solution containing water and the fluorescent tracer, Dextran-647. Yellow arrows identify the injection site. White arrowheads identify the dispersal region. (G) Dispersal region of a lysolecithin solution including the fluorescent tracer Dextran-647. Yellow arrows identify the injection site. White arrowheads identify the dispersal region. Red dashed lines denote the spinal cord. Scale bar, 50 μm.

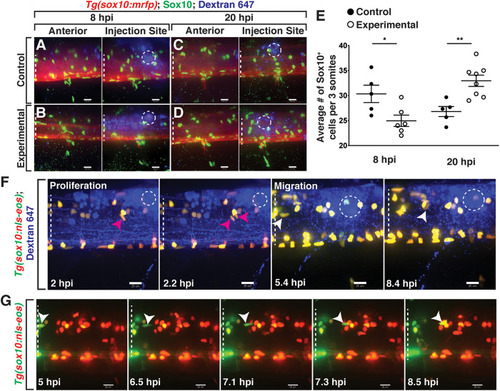
Lysolecithin alters the number and behavior of Sox10+ cells in the spinal cord. All images are lateral views of the spinal cord with anterior to the left and dorsal to the top. (A–D) 4 dpf Tg(sox10:mrfp) zebrafish larvae injected with either a control solution [control, (A,C)] or lysolecithin [experimental, (B,D)] containing the fluorescent tracer Dextran-647 to identify the injection site. Injected zebrafish were fixed at 8 hpi (A,B) or 20 hpi (C,D) and labeled with an antibody to Sox10 (green). (E) Quantification of the average number of Sox10+ cells within the injection site and spanning the width of approximately three motor nerves to capture the effects from lysolecithin (experimental) or control solutions. *p = 0.0252 at 8 hpi (n = 5 control; n = 6 experimental) and **p = 0.0033 at 20 hpi (n = 5 control; n = 8 experimental). Statistical significance was measured using an unpaired t-test. (F) Time-lapse imaging of proliferation (red arrowhead) and migration (white arrowhead) of sox10+ cells in a Tg(sox10:nls-eos) zebrafish larva following injection of lysolecithin at 4 dpf. White dashed ellipse denotes the injection site. (G) Time-lapse movie following injection of lysolecithin and photoconversion of the lesion area in a 4 dpf Tg(sox10:nls-eos) zebrafish larva. Red fluorescence denotes the photoconverted cells within the lesion. Green fluorescence denotes the cells outside of the lesion. Arrowhead identifies a sox10+ cell anterior to the injection site that migrates posteriorly into the drug dispersal region. White dashed lines denote the spinal cord. Scale bars, 25 μm.

mbp+ membrane changes are observed following exposure to lysolecithin. All images are lateral views of the spinal cord with anterior to the left and dorsal to the top. (A,B) Expression of mbp:egfp-CAAX appears as sheath-like structures in the dorsal and ventral spinal cords in 4 (A) and 6 dpf (B) zebrafish larvae. (C) Following injection of a control solution into the spinal cord of a 4 dpf mbp:eegfp-CAAX larva, the mbp+ membrane sheaths remain unchanged throughout the duration of the time-lapse movie. (D) Following injection of a lysolecithin (experimental) solution into the spinal cord of a 4 dpf mbp:egfp-CAAX larva, the mbp+ sheaths dynamically change to form ovoids (arrowheads). (E) Quantification of the percentage of zebrafish with mbp:egfp-CAAX membrane changes at 8 hpi. p < 0.0001; n = 6 control; n = 5 experimental. (F) Quantification of the average number of mbp:egfp-CAAX ovoids observed at 4, 6, and 8 hpi demonstrates an increase in the number of ovoids within the lysolecithin (experimental) group (n = 6) when compared with the control group (n = 6). At 6 hpi, *p = 0.0493. (G) Mosaically labeled oligodendrocytes by injection of mbp:mcherry-CAAX. Larvae injected with a control solution (control, top) or lysolecithin (exp. group, bottom) at 6 dpf. Following injection of a control solution (top), the oligodendrocyte remains relatively unchanged throughout the course of the time-lapse movie. In contrast, an ovoid-like structure is observed within the mbp:mcherry-CAAX+ oligodendrocyte beginning around 8.1 hpi. Red dashed lines denote the spinal cord. Scale bars, 25 μm.

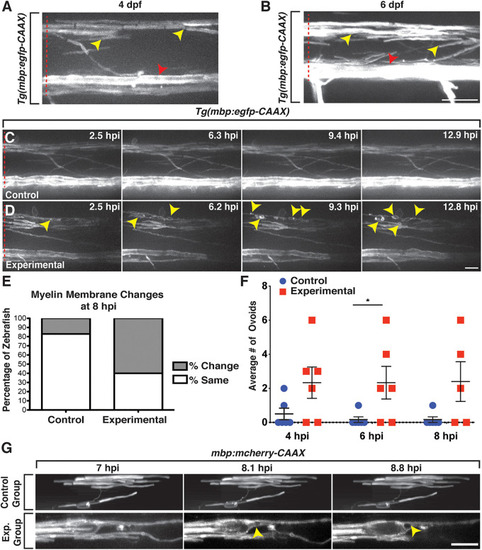
Axons are indistinguishable between control and lysolecithin-injected larvae. All images are lateral views of the spinal cord with anterior to the left and dorsal to the top. (A,B) mCherry+ axons (arrowheads) within the control (A) and lysolecithin (experimental) (B) dispersal regions are indistinguishable at 8 hpi. mbp+ ovoids are denoted with open arrowheads. Red dashed lines denote the spinal cord. Scale bars, 25 μm.

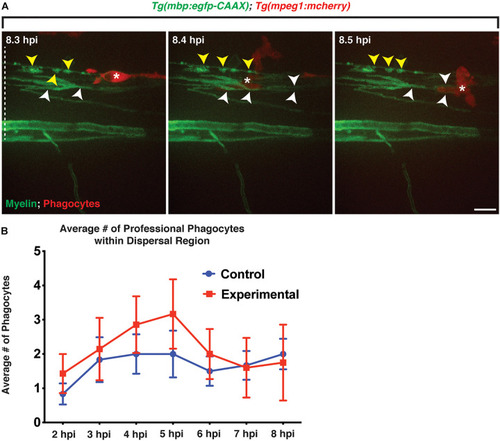
Professional phagocytes traverse through mbp+ membrane layers. All images are lateral views of the spinal cord with anterior to the left and dorsal to the top. (A) Following injection of lysolecithin, a mCherry+ phagocyte is observed traversing through mbp+ membrane layers within the lesion area, physically moving the layers during its migration. White arrowheads identify the layers that are moved by the phagocyte, and yellow arrowheads denote the myelin ovoids. (B) Quantification of the average number of professional phagocytes responding to the lesion following injection of a control (control) solution (n = 6) or lysolecithin (experimental) (n = 7); p = 0.0864. White dashed line denotes the spinal cord. Scale bars, 25 μm.

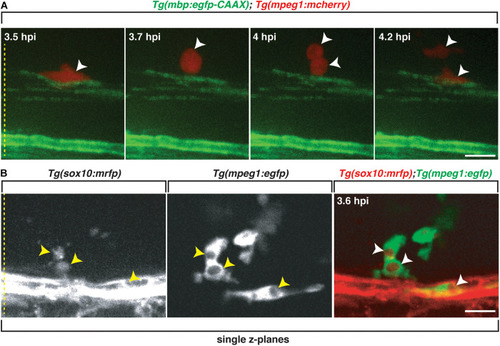
Professional phagocytes proliferate and clear Sox10+ debris. All images are lateral views of the spinal cord with anterior to the left and dorsal to the top. (A) Following injection of lysolecithin into a 4 dpf zebrafish spinal cord, a mCherry+ phagocyte recruited to the lysolecithin lesion proliferates (arrowheads). (B) Following injection of lysolecithin into a 6 dpf zebrafish spinal cord, sox10+ debris is cleared by an mpeg+ cell. Arrowheads identify the sox10+ debris within mpeg+ vacuoles in single z-planes. Yellow dashed lines denote the spinal cord. Scale bars, 25 μm.

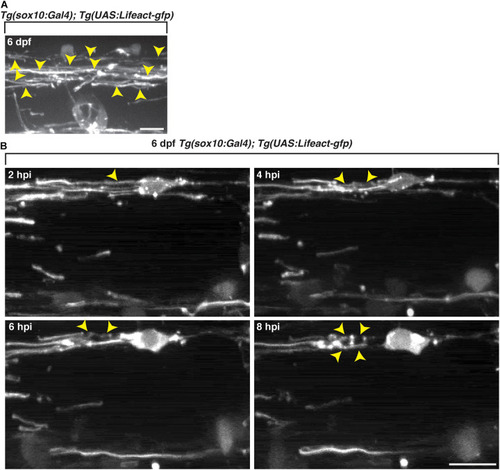
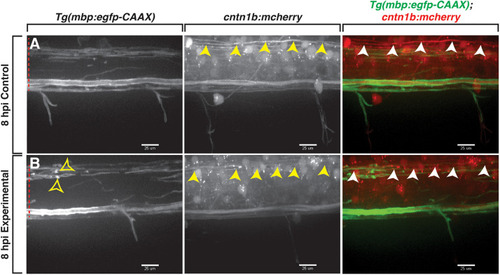
Oligodendrocyte cytoskeletal components dynamically change following exposure to lysolecithin. All images are lateral views of the spinal cord with anterior to the left and dorsal to the top. (A)In vivo imaging of Tg(sox10:Gal4; UAS:Lifeact-gfp) larvae at 6 dpf. Arrowheads denote the actin in sheath formation. (B) Following injection of lysolecithin into a 6 dpf Tg(sox10:Gal4; UAS-Lifeact-gfp) zebrafish, in vivo time-lapse imaging reveals that GFP+ F-actin dynamically changes from a sheath-like arrangement (2 hpi) to forming ovoid-like structures (8 hpi). Arrowheads identify the GFP+ F-actin changes in a sox10+ cell. Scale bars, 25 μm.

Acknowledgments
This image is the copyrighted work of the attributed author or publisher, and ZFIN has permission only to display this image to its users. Additional permissions should be obtained from the applicable author or publisher of the image. Full text @ Front Cell Dev Biol