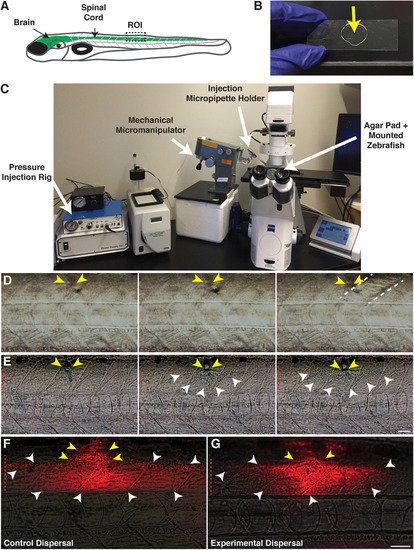
Focal delivery of solutions into the zebrafish spinal cord. (A) Cartoon of a zebrafish larvae identifying the brain and spinal cord (green). The boxed region identifies the injection site/targeted region of interest (ROI). (B) An agar pad (arrow) solidified on a borosilicate glass coverslip is used as a mounting platform for larvae to perform spinal cord injections. (C) An agar pad containing mounted larvae is placed on a microscope stage, equipped with a pressure injection rig and mechanical micromanipulator to hold the injection micropipette. (D) Muscle injections are identified by a wavy appearance following dispersal of the injection solution. Yellow arrows identify the injection site. Dotted lines denote the muscle segment injected. (E) Solutions remain localized within the spinal cord following a successful spinal cord injection. Yellow arrows identify the injection site in the dorsal spinal cord. White arrowheads identify the solution dispersal region. (F) Dispersal region of a control solution containing water and the fluorescent tracer, Dextran-647. Yellow arrows identify the injection site. White arrowheads identify the dispersal region. (G) Dispersal region of a lysolecithin solution including the fluorescent tracer Dextran-647. Yellow arrows identify the injection site. White arrowheads identify the dispersal region. Red dashed lines denote the spinal cord. Scale bar, 50 μm.
|
