FIGURE SUMMARY
Title

Nuclear exosome HMGB3 secreted by nasopharyngeal carcinoma cells promotes tumour metastasis by inducing angiogenesis

Authors
Zhang, K., Liu, D., Zhao, J., Shi, S., He, X., Da, P., You, Y., You, B.
Source
Full text @ Cell Death Dis.

Overexpression of HMGB3 is related to <italic>clinical outcomes</italic> of NPC patients.

A A Venn diagram of all upregulated genes among three GEO databases (GSE118719, GSE13597 and GSE53819) and the expression of HMGB3 in them. B HMGB3 protein levels in NPC tissues (n = 7) and normal nasopharyngeal epithelial tissue (n = 7) were examined by western blot. GD(GAPDH) was used as a loading control. C HMGB3 mRNA levels in NPC tissues (n = 7) and normal nasopharyngeal epithelial tissue (n = 7) were examined by qRT-PCR. D Representative IHC images of HMGB3 staining from NPC patients with or without metastasis and the black boxes indicate regions of pictures shown in the bottom two pictures. E Statistical comparison of HMGB3 score in the two groups. F The HMGB3 score was defined as low expression (1–8 points)(n = 94) and high expression (9–16 points)(n = 35). And the Kaplan–Meier analysis in the relationship between HMGB3 expression and metastasis of NPC. G The receiver operating characteristic (ROC) curve was plotted to validate the predictive accuracy of HMGB3 expression in metastasis NPC (ROC AUC = 0.7039). H Representative IHC images of HMGB3 staining in four TNM stages. I Statistical comparison of HMGB3 score in the four groups. J Kapla–Meier survival analysis of NPC patients’ overall survival by X-tile Software. The scale bar in 200× images represents 100 µm. Mean ± SD, *P < 0.05, **P < 0.01, ***P < 0.001, ****P < 0.0001, student’s test.

Representative IHC images of extracellular HMGB3 staining and the red arrow points to part of the extracellular staining area. B Statistical comparison of extracellular HMGB3 score in TNM stages. C Statistical comparison of extracellular HMGB3 score in the two groups with or without metastasis. D The pan-cancer analysis of the chromosome aneuploidy. E Statistical comparison of the MN numbers in TNM stages. F Statistical comparison of the MN numbers in the two groups with or without metastasis. G Spearman correlation between nuclear HMGB3 score and extracellular HMGB3 score. H Spearman correlation between nuclear HMGB3 score and the MN numbers. Pearson correlation coefficient (r2) and P value are shown. Mean ± SD, *P < 0.05, **P < 0.01, ***P < 0.001, ****P < 0.0001, student’s test.

HMGB3 knockdown reduces NPC cell proliferation and migration in vitro.

A HMGB3 protein levels in NP69 and NPC cell lines (CNE1, CNE2, 5–8 F and 6–10B) were determined by western blot. B HMGB3 mRNA levels in NP69 and NPC cell lines were examined by qRT-PCR (one-way ANOVA). C Transfection efficiency of three NPC lines (CNE1, CNE2 and 5–8 F) was measured by western blot. CON control, LIP lip2000, NC negative control, SH1 shHMGB3-1, SH2 shHMGB3-2, SH3 shHMGB3-3. D The transwell assay was performed to measure cell migration. The scale bar represents 50 µm. E Statistical comparison of the cell number of the transwell assay in the two groups. F The wound closure assay was performed to measure cell migration. The scale bar represents 200 µm. G Statistical comparison of the percentage of wound width in the two groups. H The CCK8 assays were performed to measure cell proliferation. All experiments were conducted with three independent replicates. I The levels of HMGB3 and EMT markers in NPC cell lines after knockdown or overexpression of HMGB3 were determined by western blotting. GAPDH expression was used as a loading control. Mean ± SD, **P < 0.01, ***P < 0.001,****P < 0.0001, student’s test.

Overexpression of HMGB3 correlates positively with MVD in NPC xenografts.

A, H Images of corresponding tumour xenografts. B, I Tumour volume in the two groups. C, J The weights of the excised xenografts. D, K Representative images of IHC for CD34 and HMGB3 in tissues collected from two groups of NPC xenografts. E, L Quantification of IHC staining score for HMGB3 expression. F, M Statistics of microvessel density. G, N Spearman correlation between HMGB3 score and MVD in tumour xenografts. Pearson correlation coefficient (r2) and P value are shown. The scale bar in 400× images represents 50 µm. The red arrows indicate microvessels. Mean ± SD, **P < 0.01, ***P < 0.001, ****P < 0.0001, student’s test.

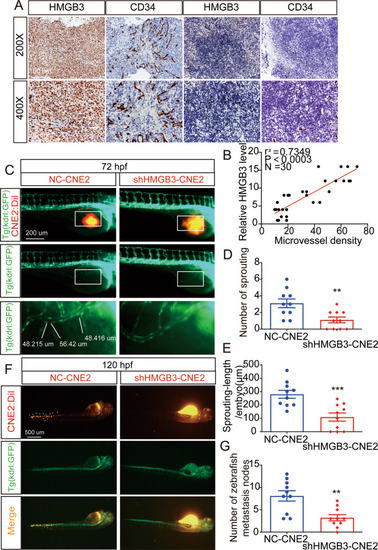
A Representative images of IHC for CD34 and HMGB3 in NPC tissues. The scale bar in 200× images represents 100 µm. B Spearman correlation between HMGB3 score and MVD in NPC patients. Pearson correlation coefficient (r2) and P value are shown. C The overall shape of 96 hpf embryos after injection of about 10 nL of Matrigel/CNE2-NC or Matrigel/CNE2-shHMGB3 solution in the perivitelline space at 48 hpf. White boxes indicate regions of pictures shown in the bottom two pictures and the analysis of the subintestinal venous plexus (SIV) was conducted. The scale bar represents 200 µm. D Quantifications with the number of sprouting of ten embryos per group. E Quantifications with the sprouting-length per embryo of ten embryos per group. F At 120 hpf, the migration of CNE2 cells was measured using fluorescence microscopy. The scale bar represents 500 µm. G Quantification of migratory cell numbers of ten embryos per group. Mean ± SD, **P < 0.01, ***P < 0.001, student’s test.

Nuclear exosomes HMGB3 derived from the micronucleus can be transferred from CNE2 to HUVECs and is associated with NPC metastasis.

A Immunofluorescence (IF) images of NP69 with or without HMGB3 overexpression. The right images show a magnified nucleus and MN. The scale bar represents 50 µm. B IF images of NP69 oeHMGB3 were stained by HMGB3 (green), CD63 (red), and nucleus (blue). The scale bar represents 20 µm. C CNE2 cells transfected with fluorescent GFP-labelled HMGB3 overexpresses lentivirus were cocultured with HUVECs in a transwell Chamber. The scale bar represents 50 μm. D Western blotting analysis of the expression of HMGB3 in exosomes from NPC serum and CNE2-CM (cell medium). E Transmission electron microscopy of exosomes derived from NPC serum and CNE2-CM. The scale bar represents 200 nm. The red boxes indicate regions of pictures shown in the bottom two pictures. F Nanoparticle tracking analysis showed the size and distribution of exosomes isolated from NPC serum and CNE2-CM. G HUVECs uptake of exosomes released by NPC with a confocal microscope. blue: Hoechst staining; red: PKH26-labelled exosomes; light blue: DRAQ5 dye-labelled DNA. H Western blotting analysis of Alix, CD9, actinin-4 and flotillin-1 in NPC exosomes and CNE2 cells. I Detection of HMGB3 in serum exosomes of NPC patients and normal persons by Western blot. JL Flow cytometry analysis showed the percentage of gDNA and HMGB3 expression in exosomes of NPC patients and normal persons. J: normal persons; K: NPC patients without metastasis; L: NPC patients with metastasis.

nEXOs HMGB3 regulates metastasis via angiogenesis.

AThe HMGB3 levels of CNE2-NC-exo and CNE2-shHMGB3-exo were measured by western blot. B Flow cytometry analysis showed the percentage of gDNA and HMGB3 expression in exosomes of CNE2 cell supernatant. C The CCK8 assays were performed to measure proliferation of HUVECs treated with the two exosomes. D The tube formation assays were performed to measure tube forming ability of HUVECs treated with various exosomes. The scale bar represents 200 μm. E Gross-observation exosomes modulated angiogenesis. F Frozen slices of the Matrigel plugs were stained with eosin-hematoxylin. The scale bar in 200× images represents 100 µm. The scale bar in 400× images represents 50 µm. G The GFP‐positive (green) intersegmental vessel (ISV) and CNE2 cells (red) are photographed by a microscope for 30 embryos per group. The red box was further photographed with a confocal microscope. The red arrow indicates a vascular defect. White arrows indicate metastasis nodes. H Percentage of vascular formation of ten embryos per group. I Quantification of migratory cell numbers. All experiments were conducted with three independent replicates. Mean ± SD, **P < 0.05, **P < 0.01, ***P < 0.001, student’s test.

Acknowledgments
This image is the copyrighted work of the attributed author or publisher, and ZFIN has permission only to display this image to its users. Additional permissions should be obtained from the applicable author or publisher of the image. Full text @ Cell Death Dis.