IMAGE

Fig. 4

ID
ZDB-IMAGE-210612-7
Source
Figures for Zhang et al., 2021
Image
Figure Caption

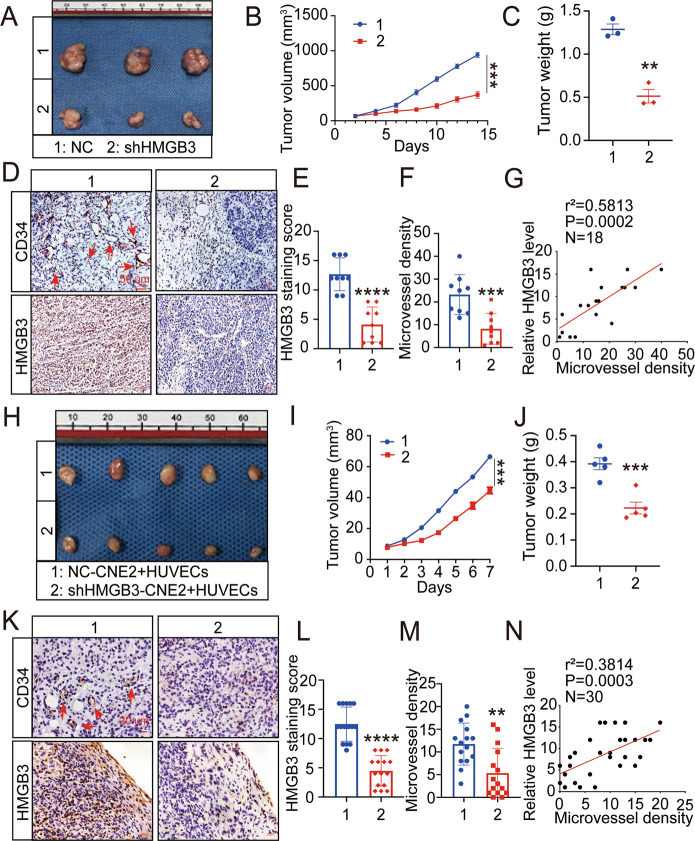
Fig. 4 Overexpression of HMGB3 correlates positively with MVD in NPC xenografts.

A, H Images of corresponding tumour xenografts. B, I Tumour volume in the two groups. C, J The weights of the excised xenografts. D, K Representative images of IHC for CD34 and HMGB3 in tissues collected from two groups of NPC xenografts. E, L Quantification of IHC staining score for HMGB3 expression. F, M Statistics of microvessel density. G, N Spearman correlation between HMGB3 score and MVD in tumour xenografts. Pearson correlation coefficient (r2) and P value are shown. The scale bar in 400× images represents 50 µm. The red arrows indicate microvessels. Mean ± SD, **P < 0.01, ***P < 0.001, ****P < 0.0001, student’s test.

Acknowledgments
This image is the copyrighted work of the attributed author or publisher, and ZFIN has permission only to display this image to its users. Additional permissions should be obtained from the applicable author or publisher of the image. Full text @ Cell Death Dis.