Effect of beclomethasone on Mm infection burden in zebrafish. (A) Bacterial burden of zebrafish larvae at four days after intravenous injection (at 28 hpf) of Mm and treatment with vehicle or different concentrations of beclomethasone (beclo), started at 2 h before infection. Statistical analysis by one-way ANOVA with Bonferroni’s post hoc test revealed that the bacterial burden was significantly increased in the group treated with 25 µM beclomethasone, compared to the burden of the vehicle-treated group. (B) Effect of the GR antagonist RU-486 on the beclomethasone-induced increase of the bacterial burden at 4 dpi. The bacterial burden was significantly increased by beclomethasone (25 µM) treatment and this increase was abolished in the presence of RU-486. Statistical analysis was performed by two-way ANOVA with Tukey’s post hoc test. In panels (A, B), each data point represents a single larva and the means ± s.e.m. of data accumulated from three independent experiments are shown in red. Statistical significance is indicated by: ns, non-significant; *P<0.05; ***P<0.001; ****P<0.0001. (C, D) Representative fluorescence microscopy images of Mm-infected larvae at 4 days post infection (dpi), representing experimental groups presented in panels (A, B) Bacteria are shown in green. Scale bar = 200 μm.

Beclomethasone effects on Mm infection progression and bacterial dissemination. (A–C). Bacterial burden (A), number of bacterial clusters (B) and the average size of bacterial clusters (C) were determined at 1, 2, 3 and 4 dpi following intravenous Mm injection (28 hpf) and treatment with vehicle or 25 µM beclomethasone, started at 2 h before infection. Significant increases due to the beclomethasone treatment were observed for all parameters at 4 dpi. For the number of bacterial clusters, the increase was also significant at 3 dpi. Statistical analysis was performed by two-way ANOVA with Tukey’s post hoc test. Each data point represents a single larva and the means ± s.e.m. of data accumulated from three independent experiments are shown in red. Statistical significance is indicated by: ***P<0.001; ****P<0.0001. (D) Effect of beclomethasone on dissemination of Mm by hindbrain ventricle injection. Hindbrain infections were performed at 28 hpf, and at 24 hours post infection (hpi), a significantly increased percentage of larvae with disseminated Mm infection was detected in the beclomethasone-treated group compared to the vehicle group. Statistical analysis was performed by two-tailed t-test. Values shown are the means ± s.e.m. of three independent experiments with a total sample size of 27 in the vehicle-treated group and 31 in the beclomethasone-treated group. Statistical significance is indicated by: *P<0.05. (E) Representative images of embryos with and without dissemination of the infection upon hindbrain injection of Mm. Scale bar = 200 μm.

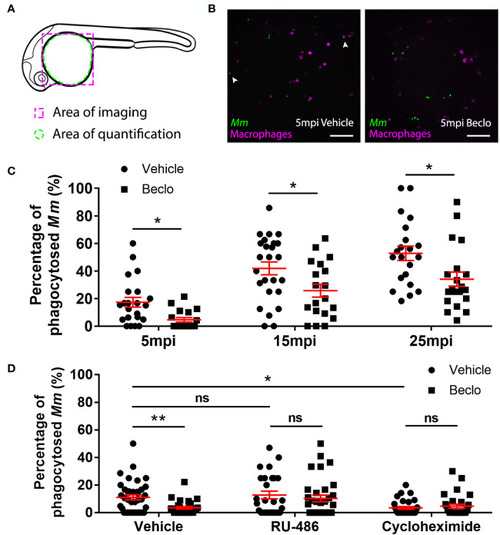
Effect of beclomethasone on phagocytic activity of macrophages and its dependency on Gr and de novo protein synthesis. (A) Schematic drawing of a zebrafish embryos at 28 hpf indicating the areas of imaging (purple dashed box, used for representative images) and quantification (green dashed circle) of Mm phagocytosis. (B) Representative confocal microscopy images of embryos of the Tg(mpeg1:mCherry-F) line injected with Mm at 28 hpf. Images were taken of infected embryos that were vehicle- or beclomethasone-treated at 5 minutes post infection (mpi). Macrophages are shown in magenta, bacteria in green. Scale bar = 100 μm. Arrowheads indicate bacterial clusters phagocytosed by macrophages. (C) Percentages of phagocytosed Mm clusters (of total number of Mm clusters) at 5, 15 and 25 mpi. Statistical analysis, performed by fitting data to a beta inflated regression with Tukey’s post hoc test, showed that beclomethasone decreased this percentage at all three time points. (D) Effects of RU-486 and cycloheximide on the beclomethasone-inhibited phagocytic activity. Embryos were treated with vehicle or beclomethasone and received either a vehicle, RU-486 or cycloheximide co-treatment two hours before injection of Mm at 28 hpf, and phagocytic activity was determined at 5 mpi. The significant inhibitory effect of beclomethasone on phagocytosis was not observed in the presence of RU-486. Cycloheximide, just like beclomethasone, significantly inhibited the phagocytic activity, and the combined cycloheximide/beclomethasone treatment showed the same level of inhibition. Statistical analysis was performed by fitting data to a beta inflated regression with Tukey’s post hoc test. In panels (C, D), each data point represents a single embryo and the means ± s.e.m. of data accumulated from three independent experiments are shown in red. Statistical significance is indicated by: ns, non-significant; *P<0.05; **P<0.01.

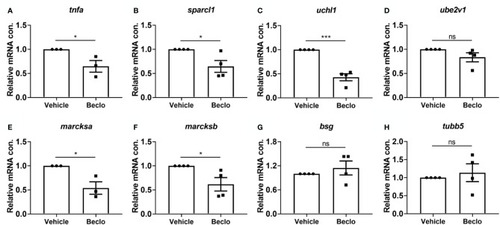
Effect of beclomethasone on gene expression levels in FACS-sorted macrophages. At 28 hpf, Tg(mpeg1:mCherry-F) embryos were treated with vehicle or beclomethasone for two hours, after which macrophages were isolated by FACS sorting. Gene expression levels were determined in the sorted cells by qPCR for tnfa(A), sparcl1(B), uchl1(C), ube2v1(D), marcksa(E), marcksb(F), bsg(G) and tubb5(H). Statistical analysis by two-tailed t-test showed that the levels of tnfa, sparcl1, uchl1, marcksa and marcksb expression were significantly inhibited by beclomethasone treatment. Data shown are the means ± s.e.m. of three or four independent experiments, and markers show averages of individual experiments. Statistical significance is indicated by: ns, non-significant; *P<0.05; ***P<0.001.

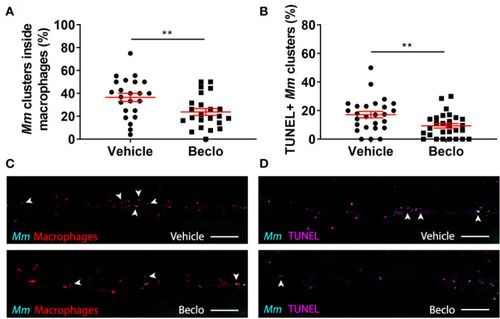
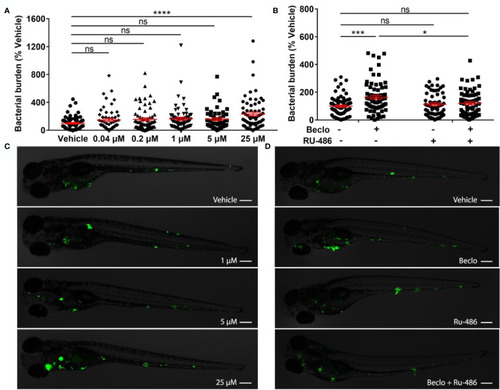
Effect of beclomethasone on intracellular bacterial growth and cell death. Infection was performed in Tg(mpeg1:eGFP) embryos at 28 hpf, a TUNEL assay was performed at 48 hpi, and the CHT region of the embryos was imaged using confocal microscopy. (A) The percentage of Mm clusters that were inside macrophages based on colocalization with the green fluorescent signal from eGFP. Statistical analysis was performed by two-tailed t-test. In the beclomethasone-treated group, the percentage of Mm clusters inside macrophages was significantly lower compared to the vehicle-treated group. (B) The percentage of TUNEL-positive Mm clusters. Statistical analysis by two-tailed t-test showed that the beclomethasone-treated group had a significantly lower percentage of TUNEL+ Mm clusters. In panels (A, B), each data point represents a single embryo and the means ± s.e.m. of data accumulated from three independent experiments are shown in red. Statistical significance is indicated by: **P<0.01. (C) Representative confocal microscopy images of macrophage phagocytosis. Bacteria are shown in blue and macrophages in red. Arrowheads indicate intracellular bacterial clusters. Scale bar = 100 μm. (D) Representative confocal microscopy images of cell death (TUNEL+ cells in magenta) and Mm infection (bacteria in blue). Arrowheads indicate bacterial clusters overlapping with TUNEL+ cells. Scale bar = 100 μm.

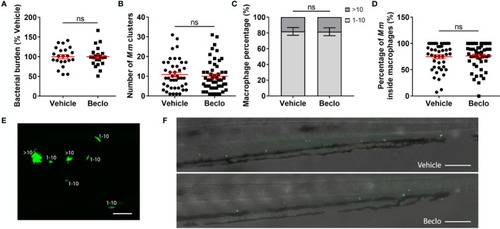
Effect of beclomethasone on the bacterial growth of the Mm Δerp mutant. The Mm Δerp mutant strain was injected intravenously at 28 hpf, and at 44 hpi, the bacterial burden (A), the number of Mm clusters (B), the percentage of macrophages that contained 1-10 or more than 10 bacteria (of all macrophages containing bacteria) (C), and the percentage of Mm inside macrophages (D) were determined. No significant difference was observed between the vehicle- and beclomethasone-treated groups for any of these parameters. Statistical analysis was performed using two-tailed t-tests. Values shown are the means ± s.e.m. of three independent experiments, with each data point representing a single embryo. Statistical significance is indicated by: ns, non-significant. (E) Representative confocal microscopy image of Mm Δerp bacterial clusters (bacteria in green), indicated are clusters containing 1-10 bacteria and clusters containing more than 10 bacteria. Scale bar = 20 μm. (F) Representative images of the tail regions of a vehicle- and a beclomethasone-treated embryo infected with Mm Δerp bacteria. Scale bar = 100 μm.

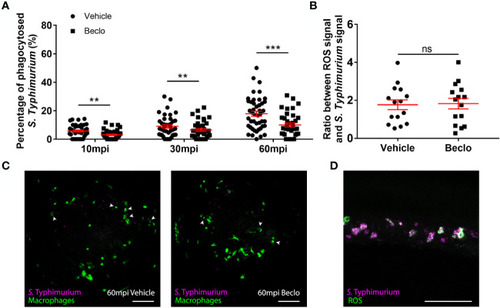
Effect of beclomethasone on phagocytosis of Salmonella Typhimurium and ROS production. At 28 hpf Tg(mpeg1:eGFP) embryos (vehicle- or beclomethasone-treated) were infected with S. Typhimurium through intravenous injection. (A) Percentage of phagocytosed S. Typhimurium wt at 10, 30 and 60 mpi. Confocal microscopy images were taken of the yolk area (as indicated in Figure 3A), and the percentage of bacteria inside macrophages was determined. Statistical analysis, performed by fitting data to a beta-inflated regression with Tukey’s post hoc test, showed that the phagocytic activity of macrophages was significantly inhibited by beclomethasone treatment at 60 mpi, and not at other time points. (B) Ratio between ROS signal and S. Typhimurium signal. Embryos were injected with a ROS biosensor strain. At 4 hpi, confocal microscopy images were taken of the CHT region and the ratio between the ROS-induced fluorescent signal and the signal from a constitutively expressed fluorescent protein in the bacteria was determined. Statistical analysis was performed by two-tailed t-test, indicating no significant difference between the two vehicle- and beclomethasone-treated groups. In panel (A, B), each data point represents a single embryo and the means ± s.e.m. of data accumulated from three independent experiments are shown in red. Statistical significance is indicated by: ns, non-significant; **P<0.01; ***P<0.001. (C) Representative confocal microscopy images of S. Typhimurium wt infected vehicle- and beclomethasone-treated individuals at 60 mpi. Bacteria are shown in magenta, macrophages in green. Arrowheads indicate bacteria phagocytosed by macrophages. Scale bar = 100 μm. (D) Representative confocal microscopy image of a vehicle-treated embryo infected with the S. Typhimurium ROS biosensor strain, showing the bacterial signal (magenta) and the ROS biosensor signal (green). Scale bar = 100 μm.

Acknowledgments
This image is the copyrighted work of the attributed author or publisher, and ZFIN has permission only to display this image to its users. Additional permissions should be obtained from the applicable author or publisher of the image. Full text @ Front Immunol