IMAGE

Figure 4

ID
ZDB-IMAGE-210530-13
Source
Figures for Xie et al., 2021
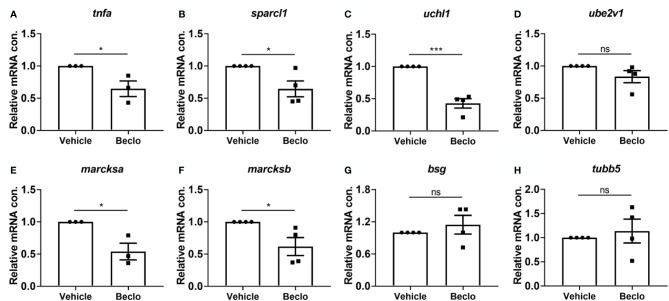
Image
Figure Caption

Figure 4

Effect of beclomethasone on gene expression levels in FACS-sorted macrophages. At 28 hpf, Tg(mpeg1:mCherry-F) embryos were treated with vehicle or beclomethasone for two hours, after which macrophages were isolated by FACS sorting. Gene expression levels were determined in the sorted cells by qPCR for tnfa(A), sparcl1(B), uchl1(C), ube2v1(D), marcksa(E), marcksb(F), bsg(G) and tubb5(H). Statistical analysis by two-tailed t-test showed that the levels of tnfa, sparcl1, uchl1, marcksa and marcksb expression were significantly inhibited by beclomethasone treatment. Data shown are the means ± s.e.m. of three or four independent experiments, and markers show averages of individual experiments. Statistical significance is indicated by: ns, non-significant; *P<0.05; ***P<0.001.

Acknowledgments
This image is the copyrighted work of the attributed author or publisher, and ZFIN has permission only to display this image to its users. Additional permissions should be obtained from the applicable author or publisher of the image. Full text @ Front Immunol