
- Title
-
Reduced PHOX2B stability causes axonal growth impairment in motor neurons with TARDBP mutations
- Authors
- Mitsuzawa, S., Suzuki, N., Akiyama, T., Ishikawa, M., Sone, T., Kawada, J., Funayama, R., Shirota, M., Mitsuhashi, H., Morimoto, S., Ikeda, K., Shijo, T., Ohno, A., Nakamura, N., Ono, H., Ono, R., Osana, S., Nakagawa, T., Nishiyama, A., Izumi, R., Kaneda, S., Ikeuchi, Y., Nakayama, K., Fujii, T., Warita, H., Okano, H., Aoki, M.
- Source
- Full text @ Stem Cell Reports
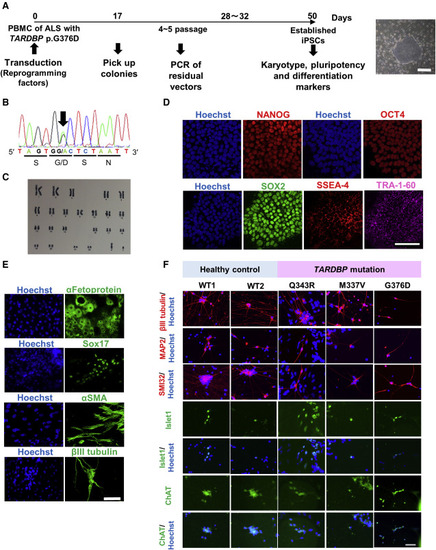
(A) Protocol for establishing iPSCs from the peripheral blood mononuclear cells (PBMCs) of a familial ALS patient harboring the TARDBP p.G376D mutation. The panel shows the selected colony. Scale bar, 500 μm. (B) Reprogrammed PBMCs that formed colonies carried the same TARDBP p.G376D mutation as the familial ALS patient. The panel shows the heterozygous c.1127G > A change (black arrow) revealed by Sanger sequencing. (C) Karyotype analysis of iPSCs harboring TARDBP p.G376D. No karyotype abnormality was detected. (D) The established iPSCs expressed pluripotency markers as evidenced by immunocytochemistry. Scale bar, 100 μm. (E) Demonstration of the three germ layer differentiation capacity of iPSCs by immunocytochemistry. The endodermal markers α-fetoprotein and SOX17, the mesodermal marker αSMA, and the ectodermal marker βIII tubulin, were all expressed by iPSCs maintained in a basic fibroblast growth factor-free medium. Scale bar, 100 μm. See also Figure S1A. (F) Established iPSCs differentiated into MNs as verified by the expression of neuron-specific markers βIII tubulin, MAP2, and SMI32, and MN-specific markers Islet1 and ChAT. Scale bar, 50 μm. See also Tables S1 and S3. |
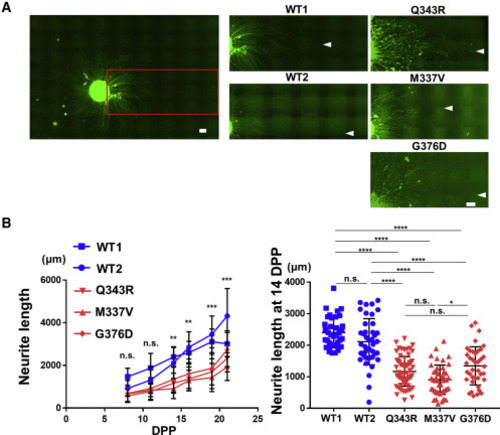
(A) Neurite lengths of iPSC-derived TARDBP mutant MNs were compared with those of healthy control MNs during culture. MNs were infected with EF-1α::Venus lentivirus vector, formed spheres, and then examined periodically under fluorescence microscopy. The white arrowheads indicate the most distal end of each neurite. Neurite lengths were compared among two healthy control MN populations derived from two separate iPSC lines (WT1 and WT2) (left) and TARDBP mutants (Q343R, M337V, and G376D) (right). Scale bar, 300 μm. (B) Changes in MN neurite length over time. Twenty to 74 neurites were analyzed per group for one experiment, depending on the time post differentiation. A comparison between the healthy control and TARDBP mutant groups showed that the neurite length significantly decreased in the TARDBP mutant group from day 14 (left graph). Statistical comparison at 14 dpp among cell lines also confirmed that TARDBP mutant MNs had significantly shorter neurites than had healthy control MNs (right graph). Repeated measures ANOVA with post hoc Tukey HSD tests for comparison between healthy control and TARDBP mutant groups. Two-way ANOVA with post hoc Tukey HSD tests for among each cell lines. ∗∗p < 0.01, ∗∗∗∗p < 0.0001 |
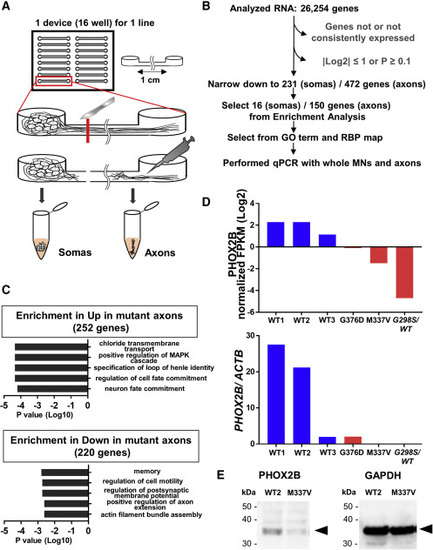
(A) Schema illustrating isolation of somas and axons from iPSC-derived MNs using microfluidic chambers. (B) Selection of candidate genes associated with TARDBP mutation-induced axonal pathology based on RNA-seq. The number of candidates was reduced from 26,254 to 231 in somas and 472 in axons on normalized fragments per kilobase of the exon model per million mapped fragments (FPKM) values |log2| > 1 and p < 0.1 (Student’s t test). From enrichment analysis, 16 genes (all genes were downregulated in the mutant) were significantly changed in the soma fraction, and 150 genes (103 genes were upregulated and 47 genes were downregulated in the mutant) were in the axon fraction. PHOX2B was selected from GO term (related to nerves, axons, transport, cytoskeleton, and inflammation), RBP map, and qPCR. See also Tables S4, S5, S6, and S7. (C) Enrichment analysis revealed significant upregulation of transcripts associated with chloride transmembrane transport, the MAPK cascade, and cell or neuron fate commitment in TARDBP mutant axons (252 genes, upper panel). By contrast, transcripts associated with memory, cell motility, postsynaptic membrane potential, and axon- or actin-related genes were significantly downregulated (220 genes, lower). (D) PHOX2B was selected from RNA-seq results. The upper graph shows RNA-seq results (normalized FPKM) and the lower graph shows qPCR results (PHOX2B/ACTB [β-actin]). PHOX2B normalized FPKM were decreased in TARDBP mutant axons. PHOX2B mRNA expression was also equal or decreased in the mutant axons with qPCR using RNA samples for RNA-seq under independent triplicates per sample. See also Figure S1B for qPCR results of N345K. (E) PHOX2B protein expression was examined by western blotting. Expression of PHOX2B (32 kDa, arrowhead) was substantially lower in TARDBP mutant MNs (M337V) compared with that in healthy control MNs (WT2), consistent with the mRNA expression pattern measured by RNA-seq and qPCR. GAPDH (37 kDa, arrowhead) was used as the gel loading control. |

(A) MNs differentiated from TARDBP mutant isogenic iPSCs also expressed neuronal and MN-specific markers. Scale bar, 50 μm. (B) MNs derived from TARDBP mutant isogenic iPSCs also exhibited significantly shorter neurites than did MNs derived from control (WT) iPSCs. Neurites were stained with RFP by infection with HB9::RFP lentivirus vector. From 20 to 77 neurites were analyzed per group depending on time post differentiation for one experiment. Two-way ANOVA with post hoc Tukey HSD tests. ∗∗∗∗P < 0.0001. (C) PHOX2B mRNA expression was also significantly lower in MNs derived from TARDBP mutant isogenic iPSCs compared with those in control MNs at 7 dpp. n = 3 independent triplicates per group. One-way ANOVA with post hoc Tukey HSD tests. ∗∗p < 0.01, ∗p < 0.05. See also Figure S2 and Tables S1–S3. |
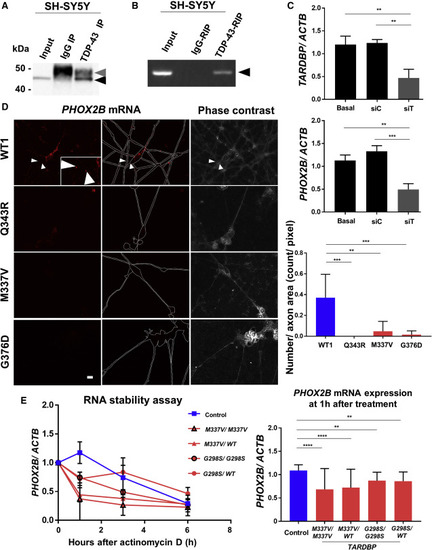
(A) Endogenous TDP-43 (43 kDa, black arrowhead) was detected by western blotting in SH-SY5Y cell immunoprecipitation samples using anti-TDP-43 antibody. The upper band indicates the immunoglobulin G (IgG) heavy chain (50 kDa, gray arrowhead). The lower IgG light chain band (25 kDa) was not shown. (B) PHOX2B mRNAs (black arrowhead) were amplified by PCR from SH-SY5Y cell RIP samples using anti-TDP-43 antibody. PHOX2B mRNA bound to TDP-43. (C) Transduction of siRNA (siTARDBP, siT) knocked down TARDBP mRNA in SH-SY5Y cells (upper graph), wherein PHOX2B mRNA also decreased (lower graph). n = 3 independent triplicates. One-way ANOVA with post hoc Tukey HSD tests. ∗∗∗p < 0.001, ∗∗p < 0.01. (D) Results of smFISH demonstrating PHOX2B mRNAs in the axons of control MNs but not TARDBP mutant MNs. The two left columns show PHOX2B mRNA fluorescence (red). The edges of the MNs are indicated by white dotted lines. Right columns show bright-field images of the same MNs. PHOX2B mRNA was detected in healthy control MN (WT1) axons (white arrowheads and inset) but was barely detectable in mutant (Q343R, M337V, and G376D) MN axons. Scale bar, 10 μm. Quantitative evaluation (right graph) was performed by dividing the red particles of PHOX2B mRNA in the axons by the number of pixels in the axon area of the phase-contrast image. The number of the particles or axon areas revealed that PHOX2B mRNA was detected in WT1 MN axons significantly more than in TARDBP mutant MN axons. n = 3–9 fields. One-way ANOVA with post hoc Tukey HSD tests. ∗∗∗p < 0.001, ∗∗p < 0.01. (E) RNA stability assay conducted in MNs at 7 dpp. PHOX2B mRNA expression rapidly decreased at 1 h of actinomycin D treatment in TARDBPM337V/M337V, TARDBPM337V/WT, TARDBPG298S/G298S, and TARDBPG298S/WT MNs, whereas this same level of degradation required 3 h of actinomycin D treatment in control MNs. Statistical analysis performed with n = 3, at 0 and 1 h, independent triplicates per treatment group. Two-way ANOVA with post hoc Tukey HSD tests. ∗∗∗∗p < 0.0001, ∗∗p < 0.01. See also Figure S3 and Tables S2 and S3. |
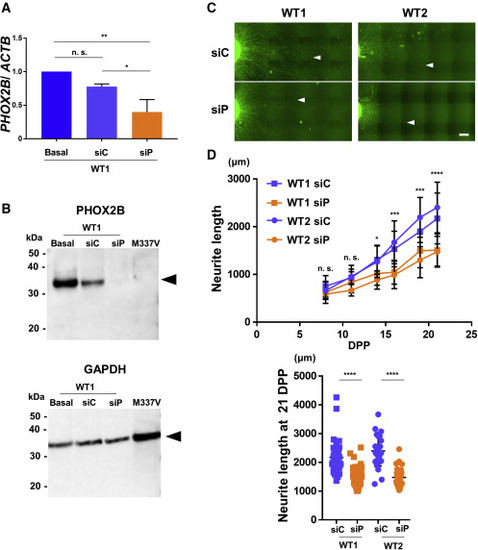
(A) Control MNs were transfected with siP or siC at 3 dpp and RNA extracted at 7 dpp for expression analysis by qPCR. MNs transfected with siP showed an approximately 50% reduction in PHOX2B expression compared with MNs transfected with siC. Statistical analysis performed on n = 3 independent triplicates. One-way ANOVA with post hoc Tukey HSD tests. ∗∗p < 0.01, ∗p < 0.05. (B) Knockdown efficiency of PHOX2B by siRNA was examined by western blotting. The reduction in PHOX2B (32 kDa, arrowhead) was comparable with that observed in M337V TARDBP mutant MNs. GAPDH (37 kDa, arrowhead) was used as the gel loading control. (C) Knockdown of PHOX2B in healthy control MNs (WT1 and WT2) reduced neurite length compared with MNs transfected with siC at 21 dpp. The white arrowheads indicate the most distal neurite ends. Scale bar, 300 μm. (D) The upper graph shows neurite length changes over time. Twenty-five to 80 neurites were analyzed per group for one experiment, depending on the time post differentiation. A comparison between the siC and siP groups showed that the neurite length significantly decreased in the siP group from day 14. The lower graph shows quantitative analysis at 21 dpp. MNs transfected with siP significantly reduced neurite length compared with MNs transfected with siC at 21 dpp. Repeated measures ANOVA with post hoc Tukey HSD tests for comparison between siC and siP. Two-way ANOVA with post hoc Tukey HSD tests for among each cell lines. ∗p < 0.05, ∗∗p < 0.01, ∗∗∗p < 0.001, ∗∗∗∗p < 0.0001. See also Tables S2 and S3. |
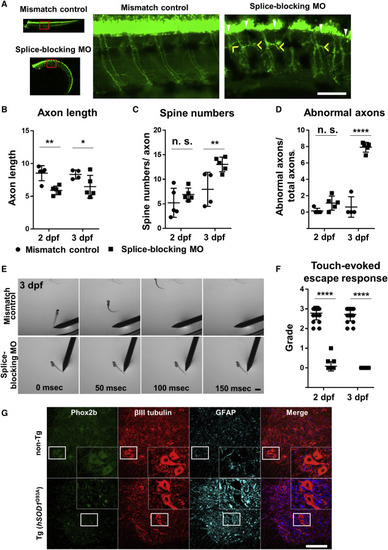
(A) Zebrafish embryos injected with a splice-blocking MO for phox2b (lower column) have shorter spinal axons and increased axonal spines compared with those injected with mismatch control MO (upper column) at 3 dpf. In zebrafish injected with the splice-blocking MO, axonal spines also became thicker (yellow arrow heads), and abnormal ectopic axons (white arrow heads) were detected. Scale bar, 100 μm. (B) Quantitative analysis of Venus-positive spinal axon length. Spinal axon length was normalized to total spinal cord length. Zebrafish embryos injected with the splice-blocking MO exhibited significantly shorter spinal axons at 2 dpf than zebrafish embryos injected with mismatch control MO. n = 4–5 animals per group. Two-way ANOVA with post hoc Tukey HSD tests. ∗∗p < 0.01, ∗p < 0.05. (C) Quantitative analysis of Venus-positive axonal spine numbers. Zebrafish embryos injected with the splice-blocking MO exhibited significantly more spines per axon at 3 dpf than zebrafish embryos injected with mismatch control MO. The average spine numbers of 13–15 axons per animal was compared in 4–5 animals per group. Two-way ANOVA with post hoc Tukey HSD tests. ∗∗p < 0.01. (D) Quantitative analysis of Venus-positive abnormal axons. Axons connecting to ectopic axons or with spines as thick as or thicker than the caudal MNs were defined as abnormal. Zebrafish embryos injected with the splice-blocking MO had significantly more abnormal axons at 3 dpf than zebrafish embryos injected with mismatch control MO. n = 4–5 animals per group. Two-way ANOVA with post hoc Tukey HSD tests. ∗∗∗∗p < 0.0001. (E) The effects of phox2b KD on motor functions were assessed by comparing touch-evoked escape responses at 3 dpf. Zebrafish embryos injected with the splice-blocking MO (lower column) were unresponsive to tail stimulation. Scale bar, 1000 μm. (F) Quantitative analysis of touch-evoked escape response grade. At 2 dpf, no zebrafish embryos injected with the splice-blocking MO swam away after tail stimulation, whereas a few reacted by tail flicking. At 3 dpf, all were unresponsive to stimulation. n = 20 per treatment group under triplicates for each animal. Two-way ANOVA with post hoc Tukey HSD tests. ∗∗∗∗p < 0.0001. See also Figure S4. (G) In hSOD1G93A Tg rats, Phox2b (green) expression was reduced in βIII tubulin (red) positive lumbar spinal cord anterior horn cells compared with the non-Tg rats. GFAP (glial fibrillary acidic protein, cyan) positive astrocytes show very faint Phox2b staining in non-Tg rats. The figure's lower end represents the ventral side. Scale bar, 200 μm. PHENOTYPE:
|

ZFIN is incorporating published figure images and captions as part of an ongoing project. Figures from some publications have not yet been curated, or are not available for display because of copyright restrictions. PHENOTYPE:
|