
|
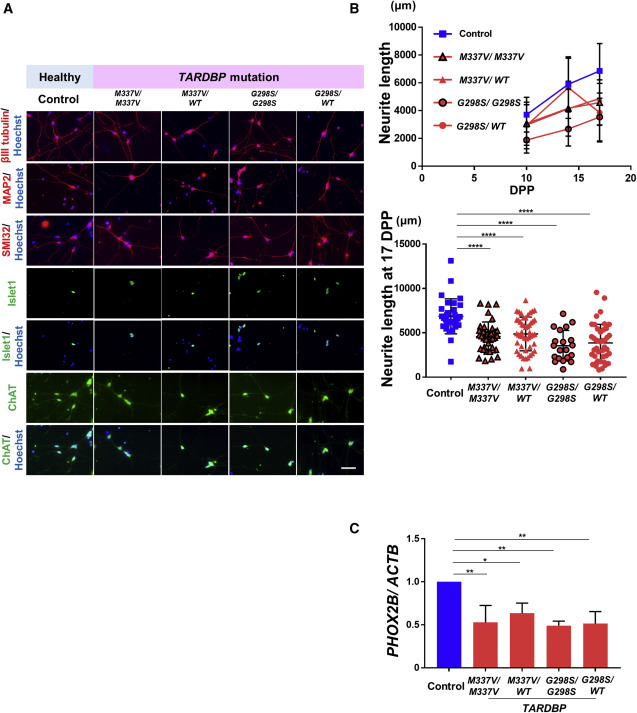
Fig. 4 (A) MNs differentiated from TARDBP mutant isogenic iPSCs also expressed neuronal and MN-specific markers. Scale bar, 50 μm. (B) MNs derived from TARDBP mutant isogenic iPSCs also exhibited significantly shorter neurites than did MNs derived from control (WT) iPSCs. Neurites were stained with RFP by infection with HB9::RFP lentivirus vector. From 20 to 77 neurites were analyzed per group depending on time post differentiation for one experiment. Two-way ANOVA with post hoc Tukey HSD tests. ∗∗∗∗P < 0.0001. (C) PHOX2B mRNA expression was also significantly lower in MNs derived from TARDBP mutant isogenic iPSCs compared with those in control MNs at 7 dpp. n = 3 independent triplicates per group. One-way ANOVA with post hoc Tukey HSD tests. ∗∗p < 0.01, ∗p < 0.05. See also Figure S2 and Tables S1–S3.