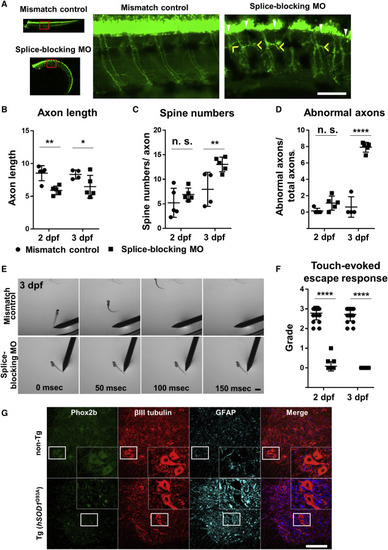
(A) Zebrafish embryos injected with a splice-blocking MO for phox2b (lower column) have shorter spinal axons and increased axonal spines compared with those injected with mismatch control MO (upper column) at 3 dpf. In zebrafish injected with the splice-blocking MO, axonal spines also became thicker (yellow arrow heads), and abnormal ectopic axons (white arrow heads) were detected. Scale bar, 100 μm. (B) Quantitative analysis of Venus-positive spinal axon length. Spinal axon length was normalized to total spinal cord length. Zebrafish embryos injected with the splice-blocking MO exhibited significantly shorter spinal axons at 2 dpf than zebrafish embryos injected with mismatch control MO. n = 4–5 animals per group. Two-way ANOVA with post hoc Tukey HSD tests. ∗∗p < 0.01, ∗p < 0.05. (C) Quantitative analysis of Venus-positive axonal spine numbers. Zebrafish embryos injected with the splice-blocking MO exhibited significantly more spines per axon at 3 dpf than zebrafish embryos injected with mismatch control MO. The average spine numbers of 13–15 axons per animal was compared in 4–5 animals per group. Two-way ANOVA with post hoc Tukey HSD tests. ∗∗p < 0.01. (D) Quantitative analysis of Venus-positive abnormal axons. Axons connecting to ectopic axons or with spines as thick as or thicker than the caudal MNs were defined as abnormal. Zebrafish embryos injected with the splice-blocking MO had significantly more abnormal axons at 3 dpf than zebrafish embryos injected with mismatch control MO. n = 4–5 animals per group. Two-way ANOVA with post hoc Tukey HSD tests. ∗∗∗∗p < 0.0001. (E) The effects of phox2b KD on motor functions were assessed by comparing touch-evoked escape responses at 3 dpf. Zebrafish embryos injected with the splice-blocking MO (lower column) were unresponsive to tail stimulation. Scale bar, 1000 μm. (F) Quantitative analysis of touch-evoked escape response grade. At 2 dpf, no zebrafish embryos injected with the splice-blocking MO swam away after tail stimulation, whereas a few reacted by tail flicking. At 3 dpf, all were unresponsive to stimulation. n = 20 per treatment group under triplicates for each animal. Two-way ANOVA with post hoc Tukey HSD tests. ∗∗∗∗p < 0.0001. See also Figure S4. (G) In hSOD1G93A Tg rats, Phox2b (green) expression was reduced in βIII tubulin (red) positive lumbar spinal cord anterior horn cells compared with the non-Tg rats. GFAP (glial fibrillary acidic protein, cyan) positive astrocytes show very faint Phox2b staining in non-Tg rats. The figure's lower end represents the ventral side. Scale bar, 200 μm.
|
