
|
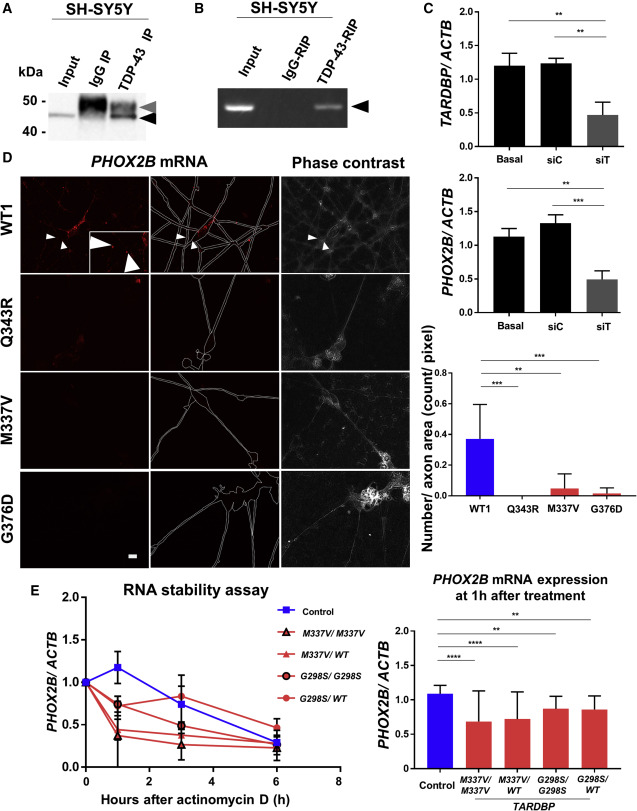
Fig. 5 (A) Endogenous TDP-43 (43 kDa, black arrowhead) was detected by western blotting in SH-SY5Y cell immunoprecipitation samples using anti-TDP-43 antibody. The upper band indicates the immunoglobulin G (IgG) heavy chain (50 kDa, gray arrowhead). The lower IgG light chain band (25 kDa) was not shown. (B) PHOX2B mRNAs (black arrowhead) were amplified by PCR from SH-SY5Y cell RIP samples using anti-TDP-43 antibody. PHOX2B mRNA bound to TDP-43. (C) Transduction of siRNA (siTARDBP, siT) knocked down TARDBP mRNA in SH-SY5Y cells (upper graph), wherein PHOX2B mRNA also decreased (lower graph). n = 3 independent triplicates. One-way ANOVA with post hoc Tukey HSD tests. ∗∗∗p < 0.001, ∗∗p < 0.01. (D) Results of smFISH demonstrating PHOX2B mRNAs in the axons of control MNs but not TARDBP mutant MNs. The two left columns show PHOX2B mRNA fluorescence (red). The edges of the MNs are indicated by white dotted lines. Right columns show bright-field images of the same MNs. PHOX2B mRNA was detected in healthy control MN (WT1) axons (white arrowheads and inset) but was barely detectable in mutant (Q343R, M337V, and G376D) MN axons. Scale bar, 10 μm. Quantitative evaluation (right graph) was performed by dividing the red particles of PHOX2B mRNA in the axons by the number of pixels in the axon area of the phase-contrast image. The number of the particles or axon areas revealed that PHOX2B mRNA was detected in WT1 MN axons significantly more than in TARDBP mutant MN axons. n = 3–9 fields. One-way ANOVA with post hoc Tukey HSD tests. ∗∗∗p < 0.001, ∗∗p < 0.01. (E) RNA stability assay conducted in MNs at 7 dpp. PHOX2B mRNA expression rapidly decreased at 1 h of actinomycin D treatment in TARDBPM337V/M337V, TARDBPM337V/WT, TARDBPG298S/G298S, and TARDBPG298S/WT MNs, whereas this same level of degradation required 3 h of actinomycin D treatment in control MNs. Statistical analysis performed with n = 3, at 0 and 1 h, independent triplicates per treatment group. Two-way ANOVA with post hoc Tukey HSD tests. ∗∗∗∗p < 0.0001, ∗∗p < 0.01. See also Figure S3 and Tables S2 and S3.