
- Title
-
Knock out of specific maternal vitellogenins in zebrafish (Danio rerio) evokes vital changes in egg proteomic profiles that resemble the phenotype of poor quality eggs
- Authors
- Yilmaz, O., Patinote, A., Com, E., Pineau, C., Bobe, J.
- Source
- Full text @ BMC Genomics
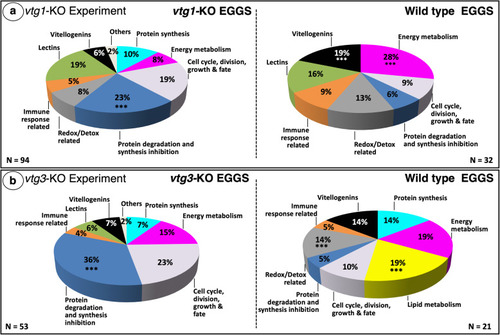
Distribution of differentially regulated proteins among functional categories. Panel a. |
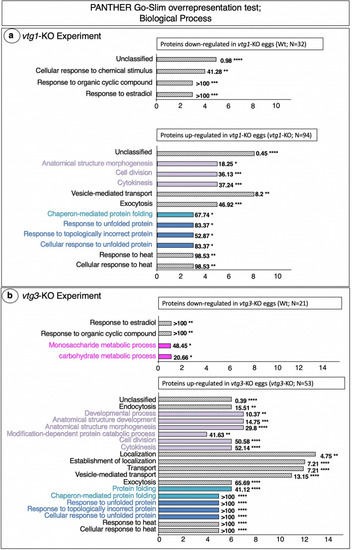
PANTHER GO Biological Processes found to be overrepresented by differentially regulated proteins. Panel a. |
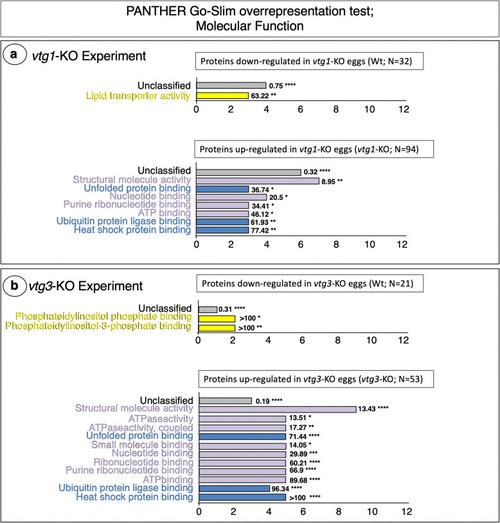
PANTHER GO Molecular Functions found to be overrepresented by differentially regulated proteins. Panel a. |
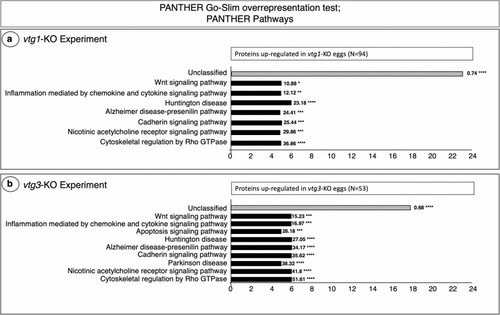
PANTHER GO Biological Pathways which are significantly over-represented by proteins up-regulated in |
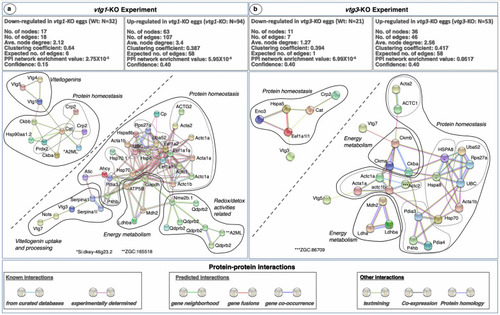
STRING Network Analysis of the differentially regulated proteins in |
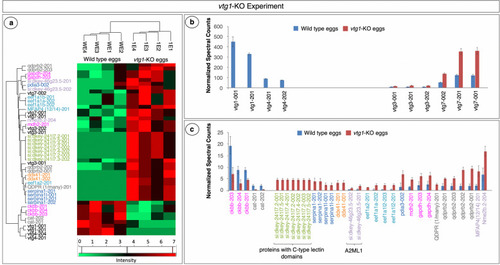
Proteins with significant differences in abundance in |
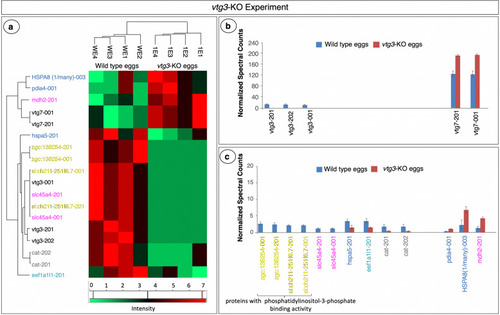
Proteins with significant differences in abundance in the vtg3-KO Experiment. Panel a. HeatMap representation of differences in abundance based on normalized spectral counts. Panel b. Vitellogenins with significant differences in abundance between vtg3-KO eggs and Wt eggs. Panel c. Other proteins with significant differences in abundance between vtg3-KO eggs and Wt eggs. All proteins are named for the transcript(s) to which spectra were mapped; for full protein names, see Table S2. Only proteins that were identified in > 4 samples were included in this analysis (t-test, p < 0.05, followed by Benjamini Hochberg correction for multiple tests, p < 0.05). Vertical bars indicate mean N-SC values (N = 4 per group) and vertical brackets indicate SEM. Protein (transcript) labels are color-coded to indicate functional categories to which the proteins were attributed (Fig. 1) |