IMAGE

Fig. 3

ID
ZDB-IMAGE-210503-5
Source
Figures for Yilmaz et al., 2021
Image
Figure Caption

Fig. 3

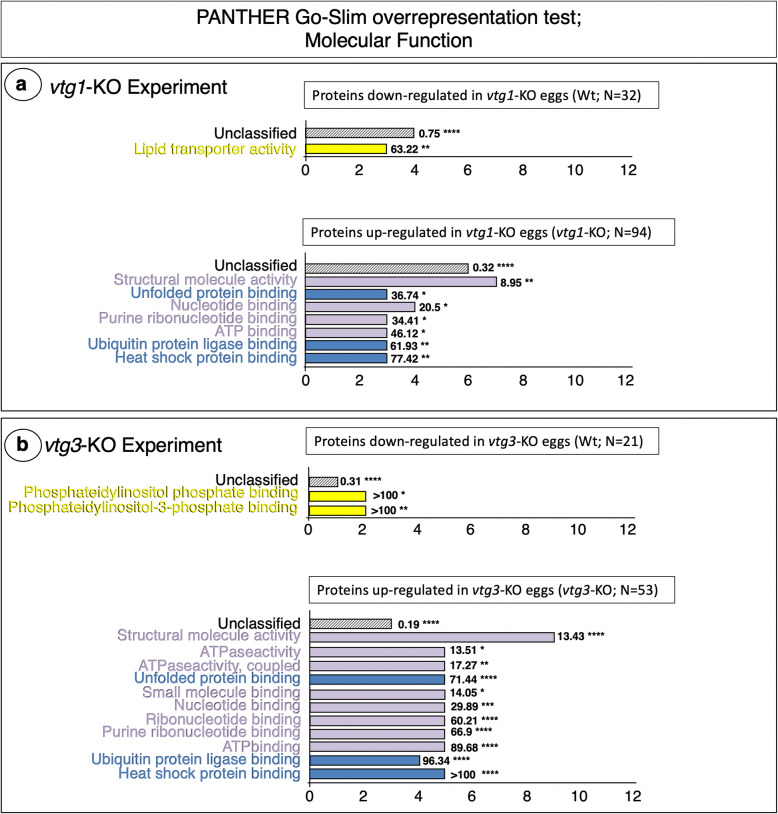
PANTHER GO Molecular Functions found to be overrepresented by differentially regulated proteins. Panel a. vtg1-KO Experiment. Panel b. vtg3-KO Experiment. Only proteins that were identified in > 4 biological samples and that exhibited a > 1.5-fold difference in N-SC between groups (vtg3-KO versus Wt), or proteins unique to a certain group, were included in this analysis. Horizontal bars indicate the number of proteins attributed to each GO term for which statistically significant results (Fisher’s Exact test, p < 0.05, followed by Bonferroni correction for multiple testing (p < 0.05)) were observed. Numbers next to the bars indicate the fold-enrichment with proteins attributed to each term and the number of asterisks indicates the significance level of the enrichment, as follows p < 0.05 (*), p < 0.01 (**), p < 0.001 (***), and p < 0.0001 (****). Where possible, horizontal bars are colored to indicate corresponding protein functional categories shown in Fig. 1; lipid metabolism (yellow), cell cycle, division, growth and fate (lavender), protein degradation and synthesis inhibition (dark blue)

Acknowledgments
This image is the copyrighted work of the attributed author or publisher, and ZFIN has permission only to display this image to its users. Additional permissions should be obtained from the applicable author or publisher of the image. Full text @ BMC Genomics