IMAGE

Fig. 5

ID
ZDB-IMAGE-210503-12
Source
Figures for Yilmaz et al., 2021
Image
Figure Caption

Fig. 5

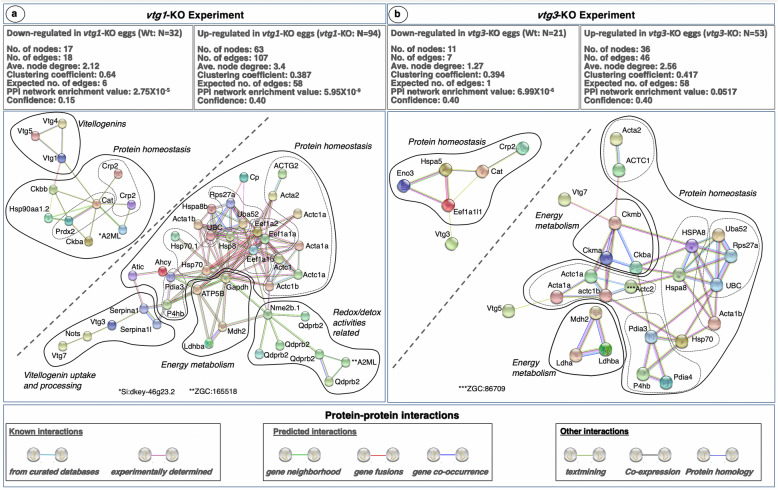
STRING Network Analysis of the differentially regulated proteins in vtg1-KO and vtg3-KO experiments. A total of 32 proteins which were down-regulated in vtg1-KO eggs and 94 proteins which were up-regulated in vtg1-KO eggs in vtg1-KO experiment, and a total of 21 proteins which were down-regulated in vtg3-KO eggs and 53 proteins which were up-regulated in vtg3-KO eggs in vtg3-KO experiment, were over-represented in specific biological pathways (Tables 1 and 2). Each network node (sphere) represents all proteins produced by a single, protein-coding gene locus (splice isoforms or post-translational modifications collapsed). Only nodes representing query proteins are shown. Nodes are named for the transcript(s) to which spectra were mapped; for full protein names, see Tables S1 and S2. Edges (colored lines) represent protein-protein associations meant to be specific and meaningful, e.g. proteins jointly contribute to a shared function but do not necessarily physically interact. Model statistics are presented at the top left and at the top right of each panel for proteins down- and up-regulated in KO eggs, respectively. Explanation of edge colors is given below panels. For each experiment, the subnetwork formed by proteins down-regulated in KO eggs is shown to the upper left above the diagonal dashed line, and the subnetwork formed by proteins up-regulated in KO eggs is shown to the lower right below the diagonal dashed line. Where possible, solid lines encircle clusters of transcripts encoding interacting proteins involved in physiological processes distinct from other such clusters (see text for details). Dashed lines identify subclusters of two or more transcripts encoding proteins of a common type

Acknowledgments
This image is the copyrighted work of the attributed author or publisher, and ZFIN has permission only to display this image to its users. Additional permissions should be obtained from the applicable author or publisher of the image. Full text @ BMC Genomics