IMAGE

Fig. 1

ID
ZDB-IMAGE-210503-3
Source
Figures for Yilmaz et al., 2021
Image
Figure Caption

Fig. 1

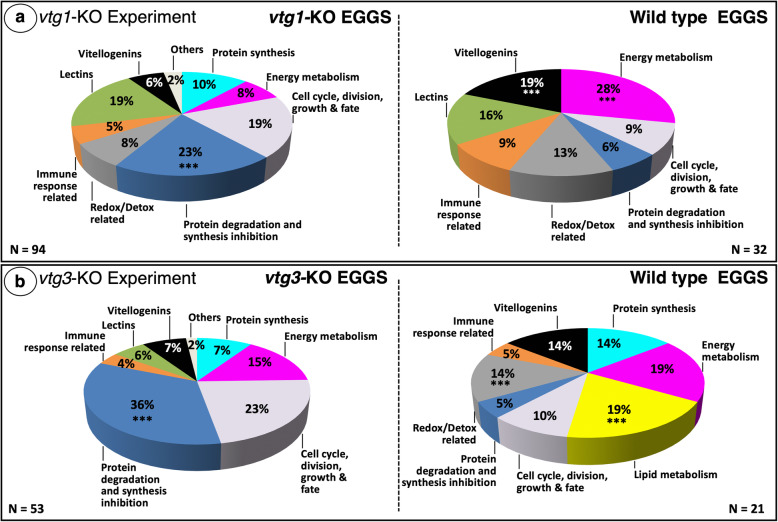
Distribution of differentially regulated proteins among functional categories. Panel a. vtg1-KO Experiment. Panel b. vtg3-KO Experiment. Only proteins that were identified in > 4 biological samples and that exhibited a > 1.5-fold difference in N-SC between groups (vtg-KO versus Wt), or proteins unique to a certain group, were included in this analysis. In both experiments, the overall distribution of differentially regulated proteins among the functional categories significantly differed between KO and Wt eggs (χ2, p < 0.05). Asterisks indicate significant differences between different groups in the proportion of differentially regulated proteins within a functional category (χ2, p < 0.05). The corresponding Ensembl Protein IDs and associated gene, transcript and protein names, functional categories (shown above), regulation (compared to Wt) (unique, up-regulated in KO or down-regulated in KO), and fold-difference in N-SC between KO and Wt eggs for proteins included in this analysis for the vtg1-KO and vtg3-KO experiments are given in Tables S1 and S2, respectively

Acknowledgments
This image is the copyrighted work of the attributed author or publisher, and ZFIN has permission only to display this image to its users. Additional permissions should be obtained from the applicable author or publisher of the image. Full text @ BMC Genomics