FIGURE SUMMARY
Title

Phenotypically Anchored mRNA and miRNA Expression Profiling in Zebrafish Reveals Flame Retardant Chemical Toxicity Networks

Authors
Dasgupta, S., Dunham, C.L., Truong, L., Simonich, M.T., Sullivan, C.M., Tanguay, R.L.
Source
Full text @ Front Cell Dev Biol

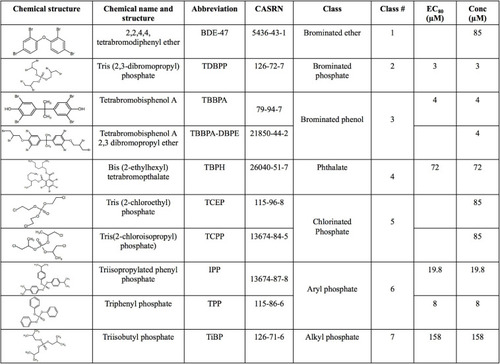
Chemical name, structure, abbreviation, CAS number, physicochemical classes, EC80 s and exposure concentrations (“Conc”) of flame retardant chemicals (FRCs) used in this study. “Conc” represents concentration used for exposures in the study. For FRCs, EC80s [exposure concentrations demonstrating 80% morphological effects based on Truong et al. (2020)] were used as exposure concentrations, except BDE-47, TCEP and TCPP where limit concentration (85 μM) or TBBPA-DBPE where a TBBPA-matched concentration (4 μM) was used.

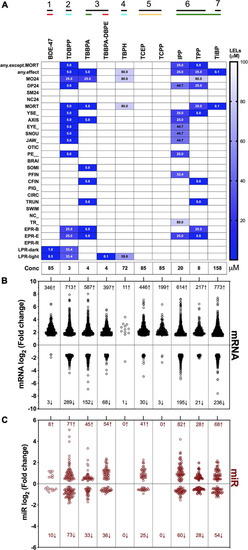
Phenotypic screening, mRNA sequencing and miR sequencing of 10 FRCs. (A) Phenotypic screening with lowest effect level (LEL) of 18 morphological endpoints and four behavioral endpoints; details about these endpoints are included in Supplementary Table 1. Data based on Truong et al. (2020). Exposure concentrations for this study are represented as “Conc.” Black lines with numbers indicate FRC classes based on Figure 1. Colored lines indicate phenotypic response groups: only behavior response; morphology + behavior response; only morphology response and no response. Embryonic photomotor response is included within morphology response and behavior response indicates only larval photomotor response. Numbers within cells represent LELs for each FRC/endpoint combination. (B) Log2 fold changes of all increased and decreased differentially expressed mRNAs across FRCs. Cutoff was log2 fold change ≥1.5 and p ≤ 0.05. Numbers represent number of genes with increased (↑) or decreased (↓) mRNA levels. (C) Log2 fold changes of increased and decreased miR levels across different FRCs. Cutoff was p ≤ 0.05. Numbers represent number of miRs with increased (↑) or decreased (↓) levels.

Major gene ontology (GO) processes across FRCs based on (A) differentially expressed mRNAs and (B) target mRNAs of differentially expressed miRs. GO was analyzed using human orthologs within Metacore. For panel (B), differentially expressed miRs were imported into TFmiR and both experimentally validated, and computationally predicted gene targets were imported into Metacore for GO analysis. Data is represented as -log (FDR p value) for each term; a value of ∼1.3 represents FDR p threshold of 0.05. Numbers within cells represent the significant -log (FDR p value). (C) Expression of representative mRNAs known to regulate nervous system development and neurotransmitter activity. Horizontal lines with numbers (1–7) represent FRC class based on Figure 1.

Heatmap representing log2 fold changes of (A) top mRNAs and (B) top miRs across FRCs. Up to 5 genes with highest increase and decrease in mRNA or miR expression levels were selected and their fold changes were plotted for all FRCs. Each column dendrogram color represents a cluster.

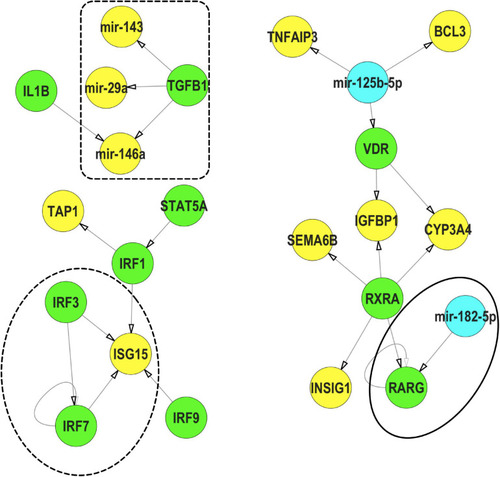
mRNA-miR interactions across FRCs based on experimentally validated predictions. (A) FRC-mRNA-miR co-regulatory network based on TFmiR gene-miR interactions. Only mRNA-miR pairs with reverse expression directions were considered for the network. (Red) FRCs, (Blue) miRs, (Yellow) miRs that were differentially expressed across 4 or more FRCs, with larger nodes denoting higher number of FRCs. mRNAs are represented within the connected lines. (B) Selected miRs that were decreased across multiple FRCs, with fold changes and major functions (based on GO analysis) of their anti-correlated mRNA targets in specific FRCs. Numbers represent FRC classes based on Figure 1. TBPH and TCPP not represented since there were no miR disruptions.

Comparison of TBBPA-DBPE and TCEP for neurotoxic effects. TBBPA-DBPE exposures showed only LPR phenotypes while TCEP showed no phenotype. (A) Heatmap representing mRNA expression for the two FRCs; colored bars on the rows represent gene clusters. (B) GO processes for unique differential mRNAs with increased (Cluster 1) and decreased (Cluster 2) in the TBBPA-DBPE exposures. (C) mRNA-miR network for the two FRCs. FRC, genes. miRs are represented within connected lines.

mRNA-transcription factor (TF) interactions across FRCs according to experimentally validated predictions. (A) FRC-mRNA-TF regulatory network based on TFmiR gene-TF interactions. FRCs, TFs. (black nodes with white text)-TFs that were differentially expressed across 5 or more FRCs, with larger nodes denoting higher number of FRCs. (B) Heatmap representing fold changes of selected TFs across all FRCs. Both zebrafish and human orthologs are provided. (C) Heatmap representing mRNA-TF combinations that were co-altered across multiple FRCs. Numbers within cells represent number of FRCs that a specific pair was altered in. Red arrows represent the FRCs for specific pairs that are discussed in the manuscript. All data based on TFmiR experimentally validated predictions.

Representative interactions between mRNA, miR and TFs that show a feed forward loop (FFL, dotted circle), a TF regulating a miR (dotted box) and a miR regulating a TF (solid circle) within IPP exposures. (Green) TFs, (Blue) miRs, (Yellow) mRNA. These interactions were selected from the mRNA-miR-TF co-regulatory network for IPP. All interaction data based on TFmiR experimentally validated predictions.

mRNA expression for TBBPA vs its derivative, TBBPA-DBPE. (A) Heatmap representing log2 fold changes of mRNA expression; colored bars on the rows represent gene clusters. Numbers within bars represent cluster numbers for specific mRNA sets. (B) GO processes for unique mRNAs that were increased or decreased uniquely in either FRC.

mRNA expression for BDE-47, aryl phosphates and chlorinated phosphates. (A,C) Heatmaps representing log2 fold changes of mRNA expression; colored bars on the rows represent mRNA clusters. Numbers within bars represent cluster numbers for specific mRNA sets. (B,D) GO processes for unique mRNAs that were increased or decreased uniquely in various clusters.

Acknowledgments
This image is the copyrighted work of the attributed author or publisher, and ZFIN has permission only to display this image to its users. Additional permissions should be obtained from the applicable author or publisher of the image. Full text @ Front Cell Dev Biol