FIGURE

FIGURE 2

ID
ZDB-FIG-210428-48
Publication
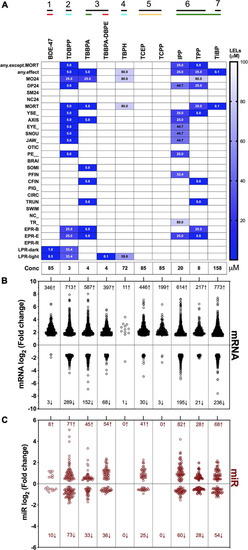
Dasgupta et al., 2021 - Phenotypically Anchored mRNA and miRNA Expression Profiling in Zebrafish Reveals Flame Retardant Chemical Toxicity Networks
Other Figures
All Figure Page
Back to All Figure Page
FIGURE 2

Phenotypic screening, mRNA sequencing and miR sequencing of 10 FRCs. (A) Phenotypic screening with lowest effect level (LEL) of 18 morphological endpoints and four behavioral endpoints; details about these endpoints are included in Supplementary Table 1. Data based on Truong et al. (2020). Exposure concentrations for this study are represented as “Conc.” Black lines with numbers indicate FRC classes based on Figure 1. Colored lines indicate phenotypic response groups: only behavior response; morphology + behavior response; only morphology response and no response. Embryonic photomotor response is included within morphology response and behavior response indicates only larval photomotor response. Numbers within cells represent LELs for each FRC/endpoint combination. (B) Log2 fold changes of all increased and decreased differentially expressed mRNAs across FRCs. Cutoff was log2 fold change ≥1.5 and p ≤ 0.05. Numbers represent number of genes with increased (↑) or decreased (↓) mRNA levels. (C) Log2 fold changes of increased and decreased miR levels across different FRCs. Cutoff was p ≤ 0.05. Numbers represent number of miRs with increased (↑) or decreased (↓) levels.

Expression Data

Expression Detail
Antibody Labeling
Phenotype Data

Phenotype Detail
Acknowledgments
This image is the copyrighted work of the attributed author or publisher, and ZFIN has permission only to display this image to its users. Additional permissions should be obtained from the applicable author or publisher of the image. Full text @ Front Cell Dev Biol