
- Title
-
Calcium State-Dependent Regulation of Epithelial Cell Quiescence by Stanniocalcin 1a
- Authors
- Li, S., Liu, C., Goldstein, A., Xin, Y., Ke, C., Duan, C.
- Source
- Full text @ Front Cell Dev Biol
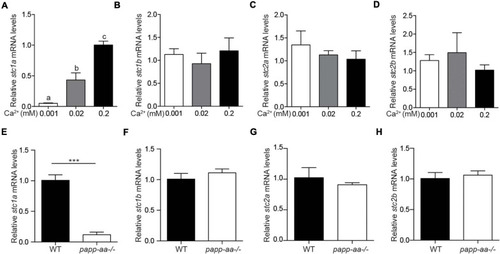
The expression of EXPRESSION / LABELING:
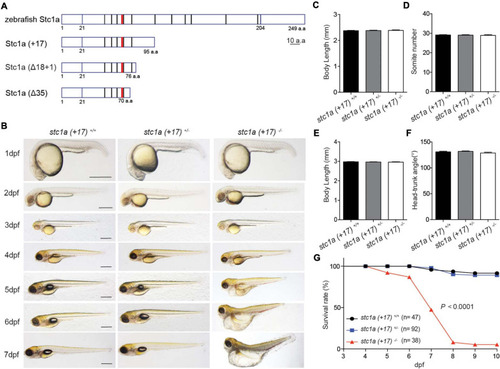
PHENOTYPE:
|
Genetic deletion of |
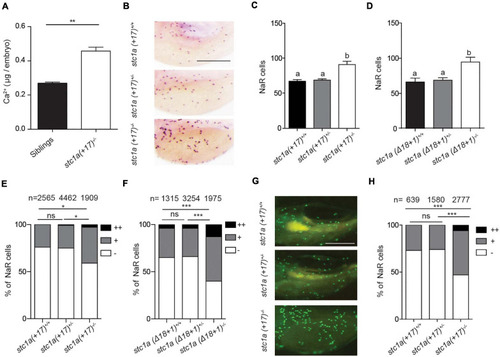
Genetic deletion of |
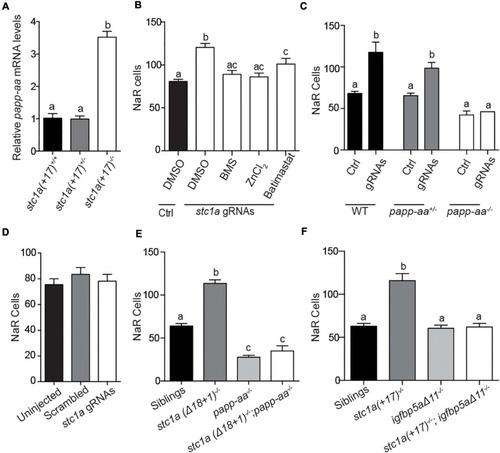
Papp-aa and Igfbp5a are indispensible for Stc1a action in NaR cells. |
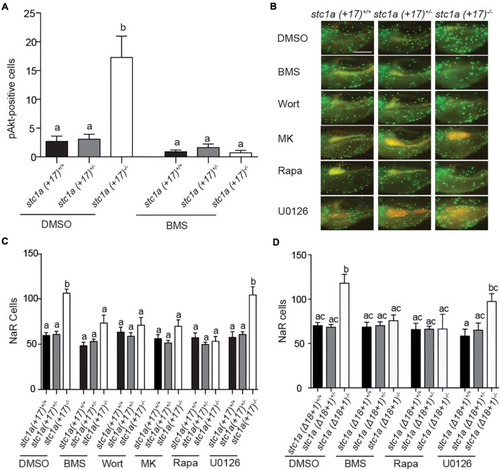
Stc1a promotes NaR cell quiescence by suppressing IGF-PI3 kinase-Akt-Tor signaling in NaR cells. EXPRESSION / LABELING:
PHENOTYPE:
|
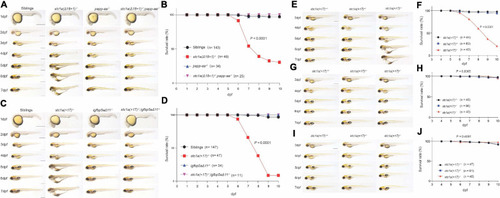
Perturbation of the Papp-aa-Igfbp-a-IGF signaling loop rescues the body edema and premature death in PHENOTYPE:
|
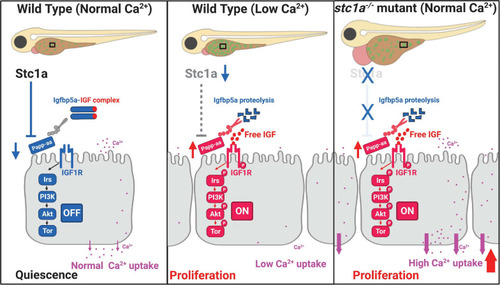
Proposed model of Stc1a function as a [Ca2+] state-regulated regulator of local IGF signaling and its role in epithelial cell quiescence-proliferation balance. |