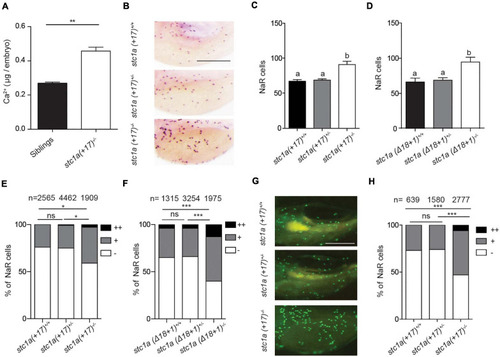
Genetic deletion of stc1a results in elevated body Ca2+ content and increased NaR cell proliferation. (A) Total body Ca2+ content in 5 dpf zebrafish larvae of the indicated genotypes. Data shown are from 3 independent experiments, each containing 35 larvae/group. **P < 0.01 by unpaired two-tailed t-test. (B–D) Progenies of stc1a (+17)+/– intercrosses (C) or progenies of stc1a (Δ18 + 1)+/– intercrosses (D) were raised in the E3 embryo medium to 5 dpf. NaR cells were detected by in situ hybridization using an igfbp5a cRNA probe. After NaR cells were visualized and quantified in each fish, fish were genotyped individually. Representative images are shown in (B) and quantified data in (C,D). Scale bar = 0.2 mm. n = 33–70 larvae/group (C) and 19–46 larvae/group (D). (E,F) NaR cells in 5 dpf larvae of the indicated genotypes were scored following a published proliferation scoring index (Liu et al., 2018). Cells that divided 0, 1, or 2 times were scored as -, +, and ++. *P < 0.05 and ***P < 0.001 by Chi-square test. Total number of cells is shown above the bar. (G,H) Progenies of stc1a (+17)+/–; Tg (igfbp5a: GFP) intercrosses were raised in E3 embryo medium until 5 dpf. GFP-expressing NaR cells were scored as described in (E). Representative images are shown in (G) and quantified results in (H). Scale bar = 0.2 mm. ***P < 0.001 by Chi-square test.
|
