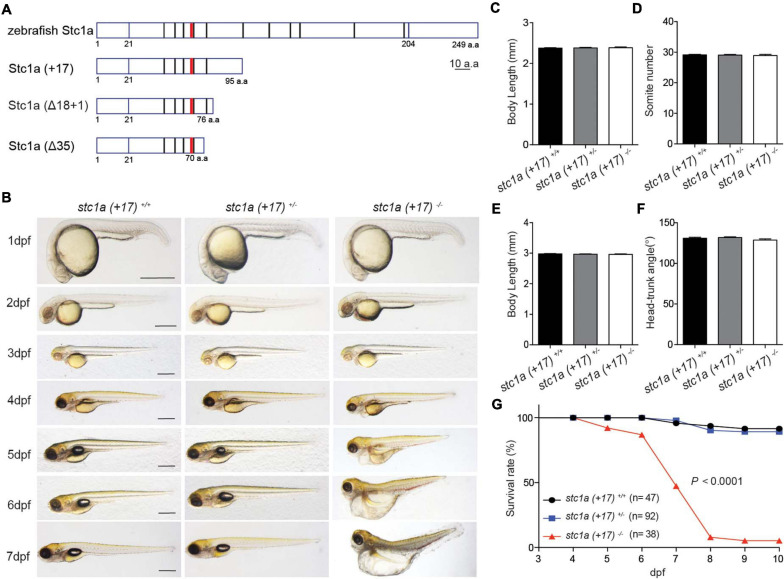
IMAGE

FIGURE 2

ID
ZDB-IMAGE-210428-48
Source
Figures for Li et al., 2021
Image
Figure Caption

FIGURE 2

Genetic deletion of stc1a results in cardiac edema, body swelling, and premature death. (A) Schematic diagram of Stc1a protein and the indicated mutants. The N-linked glycosylation site and conserved cysteine residues are shown by red and black bars, respectively. (B) Morphology of fish of the indicated genotypes at the indicated stages. Lateral views with anterior to the left and dorsal up. Scale bar = 0.5 mm. (C–F) Body length, somite number, and head-trunk angle of the indicated genotypes at 24 hpf (C,D) and 48 hpf (E,F). n = 15–42 fish/group. (G) Survival curves. Progenies of stc1a (+17)+/– intercrosses were raised in E3 embryo medium. Dead embryos were collected daily and genotyped individually. The survival curves of indicated genotypes and the total fish numbers are shown. P < 0.0001 by log-rank test.

Figure Data
Acknowledgments
This image is the copyrighted work of the attributed author or publisher, and ZFIN has permission only to display this image to its users. Additional permissions should be obtained from the applicable author or publisher of the image. Full text @ Front Cell Dev Biol