
- Title
-
Comparative Proteome Research in a Zebrafish Model for Vanishing White Matter Disease
- Authors
- Kim, D., Lee, Y.R., Choi, T.I., Kim, S.H., Kang, H.C., Kim, C.H., Lee, S.
- Source
- Full text @ Int. J. Mol. Sci.

ZFIN is incorporating published figure images and captions as part of an ongoing project. Figures from some publications have not yet been curated, or are not available for display because of copyright restrictions. EXPRESSION / LABELING:
PHENOTYPE:
|
|
ZFIN is incorporating published figure images and captions as part of an ongoing project. Figures from some publications have not yet been curated, or are not available for display because of copyright restrictions. EXPRESSION / LABELING:
PHENOTYPE:
|
|
ZFIN is incorporating published figure images and captions as part of an ongoing project. Figures from some publications have not yet been curated, or are not available for display because of copyright restrictions. EXPRESSION / LABELING:
PHENOTYPE:
|
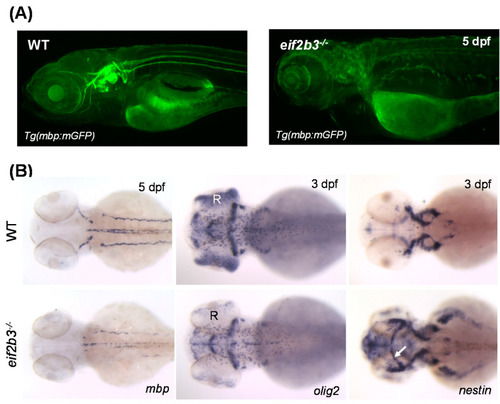
Zebrafish eif2b3 knockout model for VWM disease. (A) Visualization of myelination using Tg (mbp:mGFP) crossed with eif2b3−/− zebrafish at 5 dpf. Myelination defects in eif2b3−/− which recapitulate phenotypes of VWM disease. (B) Whole-mount in situ hybridization with myelin development markers, mbp, olig2, and nestin in eif2b3−/− zebrafish. mbp, myelin basic protein; oilg2, oligodendrocyte transcription factor; nestin, early neural stem/progenitor cell marker. Arrow indicates ectopic expression of nestin in the midbrain region. R, retina. EXPRESSION / LABELING:
PHENOTYPE:
|
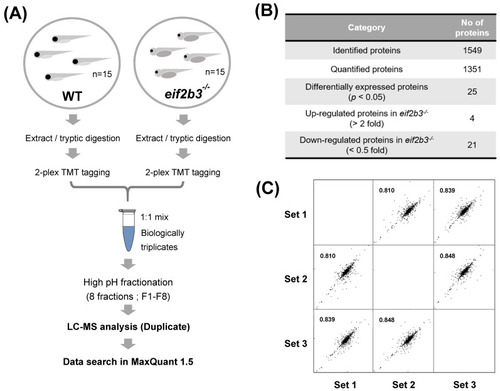
Workflow for comparative proteome analysis in an eif2b3 knockout. (A) Flowchart illustrating the experimental procedure for quantification of regulated proteins in the eif2b3−/− model. (B) The table showing the number of proteins identified in WT and eif2b3−/− model, respectively. (C) Highly correlated results of triplicate analyses. |
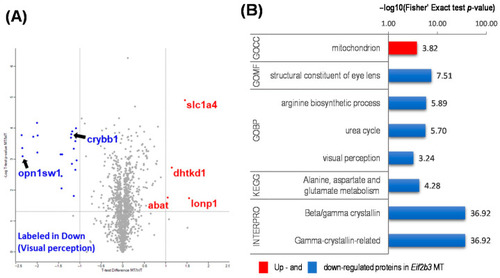
Functional annotation of differentially expressed proteins (DEP) in the WT and eif2b3 knockout. (A) Distribution of the 1352 quantified proteins (upregulated, red filled circles; downregulated, blue filled circles) in eif2b3−/− compared to the WT, according to one-sample t-tests and fold change (p < 0.05). (B) DAVID-generated GO enrichment and KEGG pathway analysis of DEPs. The–log of Fisher’s exact test was used to represent the enrichment index. GOBP: Gene Ontology Biological Process, CC: cellular component, MF: molecular function, KEGG: Kyoto Encyclopedia of Genes and Genomes. |
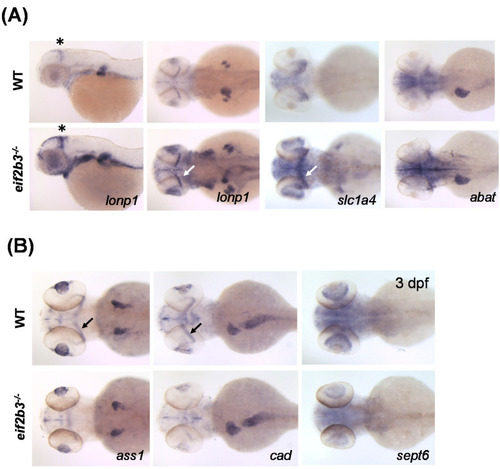
Visualization of differently expressed proteins in WT and eif2b3 knockout zebrafish. (A) Whole-mount in situ hybridization of WT and eif2b3−/− probed for lonp1, slc1a4, and abat upregulated genes. (B) Whole-mount in situ hybridization of WT and eif2b3−/− probed for ass1, cad, and sept6 downregulated genes. * The asterisk and arrow indicate the midbrain-hindbrain boundary (MHB). EXPRESSION / LABELING:
PHENOTYPE:
|