
IMAGE
Figure 4
Image
|
Figure Caption
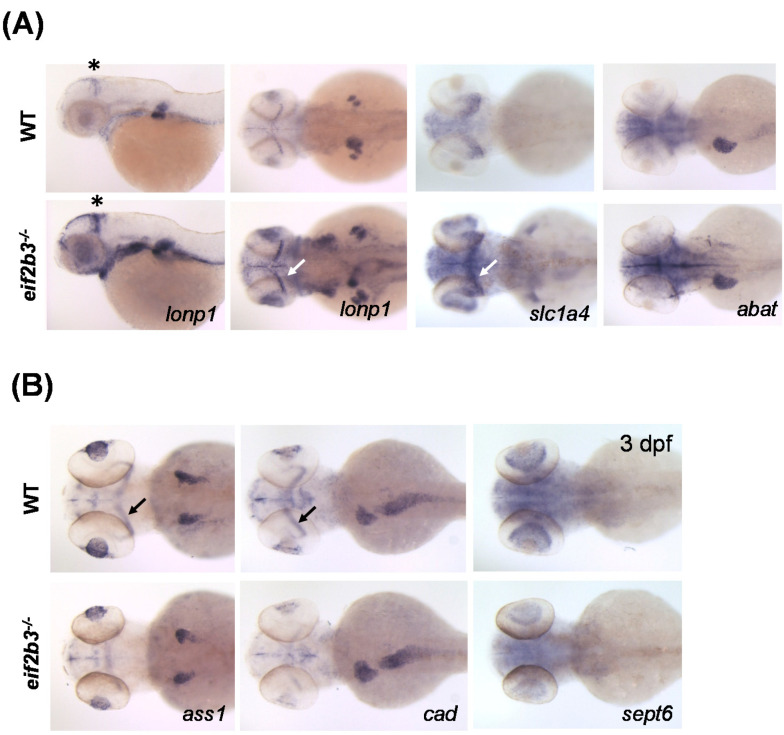
Figure 4 Visualization of differently expressed proteins in WT and eif2b3 knockout zebrafish. (A) Whole-mount in situ hybridization of WT and eif2b3−/− probed for lonp1, slc1a4, and abat upregulated genes. (B) Whole-mount in situ hybridization of WT and eif2b3−/− probed for ass1, cad, and sept6 downregulated genes. * The asterisk and arrow indicate the midbrain-hindbrain boundary (MHB).
Figure Data
Acknowledgments
This image is the copyrighted work of the attributed author or publisher, and
ZFIN has permission only to display this image to its users.
Additional permissions should be obtained from the applicable author or publisher of the image.
Full text @ Int. J. Mol. Sci.