FIGURE SUMMARY
Title

Transcription organizes euchromatin via microphase separation

Authors
Hilbert, L., Sato, Y., Kuznetsova, K., Bianucci, T., Kimura, H., Jülicher, F., Honigmann, A., Zaburdaev, V., Vastenhouw, N.L.
Source
Full text @ Nat. Commun.

Transcription onset after mitosis establishes transcription pockets and euchromatin domains.

a Sketch of nuclear compartmentalization in a typical nucleus and in the nucleus of a late blastula (sphere) stage zebrafish embryo. b Representative mid-sections of nuclei after mitosis and before transcription onset (Low Pol II Ser2Phos), and after transcription onset (High Pol II Ser2Phos). The same results were obtained in four independent experiments. c DNA image contrast (CDNA) for low and high Pol II Ser2Phos nuclei. Mean ± SD, * indicates P < 0.05 (P value 0.02 from a two-sided permutation test, n = 24,58 nuclei, from five different samples). d Representative nuclear mid-sections for control and α-amanitin treatment. The same results were obtained in two independent experiments. eCDNA for control and α-amanitin (A-Am) treatment. Mean ± SD, *** indicates P < 0.001 (P value 0.00007 from a two-sided permutation test, n = 17,18 nuclei, from two different samples per condition). f Representative three-color micrographs showing DNA, RNA, and transcriptional activity (Pol II Ser2Phos) in a nuclear mid-section after transcription onset. The same results were obtained in four independent experiments. g 2D histogram displaying the frequency of observing a pixel with a specific RNA fluorescence intensity (IRNA) together with a given DNA intensity (IDNA). Solid and dashed lines are median and 25th and 75th percentile, respectively. n = 60 nuclei after transcription onset were used for analysis. h 3D pseudo-surface plot displaying the mean Pol II Ser2Phos intensity (ISer2Phos) observed for a given IRNA and IDNA. Same nuclei as in panel g were used for analysis. i Representative nuclear mid-sections showing RNA smFISH detection of transcription sites of the zygotic transcripts sox19a and zic2b. The same results were obtained in two independent experiments. All microscopy images in this figure were acquired by STED super-resolution microscopy.

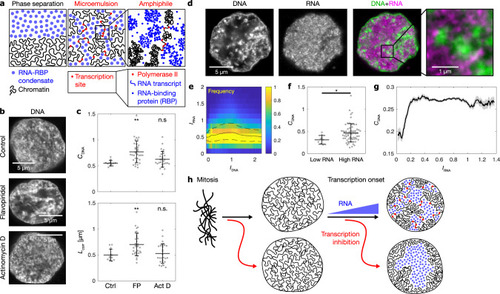
RNA accumulation establishes euchromatin domains, which are maintained in a finely dispersed pattern by transcriptional activity.

a Cartoon representation of conventional phase separation and a microemulsion. Right panel focuses on the amphiphile in the microemulsion. b Representative micrographs of nuclear mid-sections obtained from cells treated for 30 min with the indicated inhibitors. The same results were obtained in two independent experiments. c Quantification of DNA image contrast (CDNA) and correlation length (Lcorr) for the different inhibitor treatments: control treatment (Ctrl), flavopiridol (FP), actinomycin D (Act D). Mean ± SD, ** indicates P < 0.01, n.s. indicates P ≥ 0.05 (CDNAP values 0.002, 0.22 from a two-sided permutation test, LcorrP values 0.007, 1.2 from a two-sided permutation test, P values with Bonferroni correction for multiple testing, n = 12,34,29 nuclei from four, three, four different samples). d Representative nuclear mid-section of a flavopiridol-treated cell. The same results were obtained in three independent experiments. e 2D histogram displaying the frequency of pixel-level RNA intensity (IRNA) and DNA intensity (IDNA). Solid and dashed lines are median and 25th and 75th percentile, respectively. f Quantification of CDNA and Lcorr in flavopiridol-treated cells with low and high levels of RNA (the threshold for high RNA is IRNA = 0.25). Mean ± SD, * indicates P < 0.05 (P value 0.03 from a two-sided permutation test, n = 9,62 from five different samples). g Running average (mean ± SEM), window width 0.1, windows with n ≥ 30 nuclei are drawn. h Sketch summarizing the experimental observations to this point. Microscopy data in bf obtained by STED microscopy, g by spinning disk confocal microscopy.

A microemulsion model reproduces key features of euchromatin organization.

a Model mechanism 1: segregation of RNA-RBP condensates from chromatin. b Model mechanism 2: tethering of RNA-RBP complexes to transcriptionally active chromatin, forming amphiphilic connections. c Illustration of the lattice model for euchromatin organization, indicating chromatin chains and RNA-binding proteins with different states, as well as the costs for placing different types of lattice sites next to each other. See Supplementary Table 1 for model parameters. d Configurations of chromatin (white) in long-term simulations of the lattice model with (i) no RNA and no transcription, (ii) RNA and no transcription, and (iii) RNA and transcription. e Concentration profiles from simulations with example STED nuclear mid-sections from corresponding experimental conditions: control treatment (Ctrl), flavopiridol (FP), actinomycin D (Act D). The same results were obtained in four independent experiments. f Comparison of DNA image contrast (CDNA) and correlation length (Lcorr) from simulations and STED mid-nuclear sections. Mean ± SD, ** indicates P < 0.01, *** indicates P < 0.001, n.s. indicates P ≥ 0.05 (CDNAP values <10−5, 0,33 from a two-sided permutation test, LcorrP values 0.003, 1.09 from a two-sided permutation test, P values with Bonferroni correction for multiple testing and resampling n matched to experiments, n = 96,93,46 simulations, for a description of the statistics of experiments, see Fig. 2c).

Transcription onset locally reorganizes euchromatin.

a Representative simulated time-lapse of transcription onset (Transcription), RNA accumulation (RNA), and euchromatin organization (DNA) in the vicinity of a single transcriptionally activated chromatin chain. The same results were obtained in 12 simulations. b Radial analysis, starting at the time when transcription foci were first detected. The range indicates the radial distance from the centroid of a given transcription focus. Analysis averaged over 12 simulations. c Representative spinning disk confocal microscopy time lapse of elongating RNA polymerase II (Pol II Ser2Phos, visualized with phospho-specific antibody fragments) and DNA (SiR-DNA). Images show nuclear mid-sections of a single nucleus taken from zebrafish embryonic cell culture corresponding to the late blastula (sphere) stage. The same results were obtained in three independent experiments. d Radial analysis averaged over time-lapse recordings from 13 nuclei.

Acknowledgments
This image is the copyrighted work of the attributed author or publisher, and ZFIN has permission only to display this image to its users. Additional permissions should be obtained from the applicable author or publisher of the image. Full text @ Nat. Commun.