|
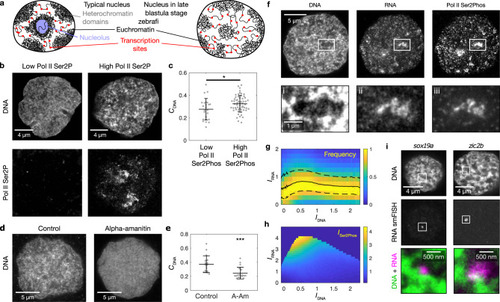
Transcription onset after mitosis establishes transcription pockets and euchromatin domains.a Sketch of nuclear compartmentalization in a typical nucleus and in the nucleus of a late blastula (sphere) stage zebrafish embryo. b Representative mid-sections of nuclei after mitosis and before transcription onset (Low Pol II Ser2Phos), and after transcription onset (High Pol II Ser2Phos). The same results were obtained in four independent experiments. c DNA image contrast (CDNA) for low and high Pol II Ser2Phos nuclei. Mean ± SD, * indicates P < 0.05 (P value 0.02 from a two-sided permutation test, n = 24,58 nuclei, from five different samples). d Representative nuclear mid-sections for control and α-amanitin treatment. The same results were obtained in two independent experiments. eCDNA for control and α-amanitin (A-Am) treatment. Mean ± SD, *** indicates P < 0.001 (P value 0.00007 from a two-sided permutation test, n = 17,18 nuclei, from two different samples per condition). f Representative three-color micrographs showing DNA, RNA, and transcriptional activity (Pol II Ser2Phos) in a nuclear mid-section after transcription onset. The same results were obtained in four independent experiments. g 2D histogram displaying the frequency of observing a pixel with a specific RNA fluorescence intensity (IRNA) together with a given DNA intensity (IDNA). Solid and dashed lines are median and 25th and 75th percentile, respectively. n = 60 nuclei after transcription onset were used for analysis. h 3D pseudo-surface plot displaying the mean Pol II Ser2Phos intensity (ISer2Phos) observed for a given IRNA and IDNA. Same nuclei as in panel g were used for analysis. i Representative nuclear mid-sections showing RNA smFISH detection of transcription sites of the zygotic transcripts sox19a and zic2b. The same results were obtained in two independent experiments. All microscopy images in this figure were acquired by STED super-resolution microscopy.
|