IMAGE

Fig. 4

ID
ZDB-IMAGE-210315-4
Source
Figures for Hilbert et al., 2021
Image
Figure Caption

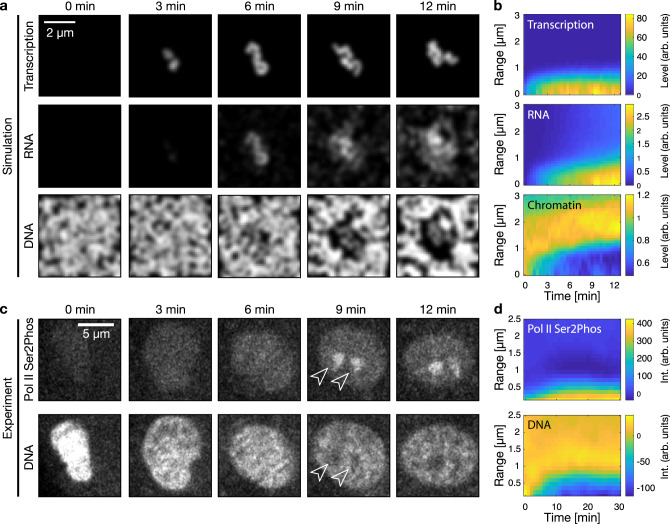
Fig. 4 Transcription onset locally reorganizes euchromatin.

a Representative simulated time-lapse of transcription onset (Transcription), RNA accumulation (RNA), and euchromatin organization (DNA) in the vicinity of a single transcriptionally activated chromatin chain. The same results were obtained in 12 simulations. b Radial analysis, starting at the time when transcription foci were first detected. The range indicates the radial distance from the centroid of a given transcription focus. Analysis averaged over 12 simulations. c Representative spinning disk confocal microscopy time lapse of elongating RNA polymerase II (Pol II Ser2Phos, visualized with phospho-specific antibody fragments) and DNA (SiR-DNA). Images show nuclear mid-sections of a single nucleus taken from zebrafish embryonic cell culture corresponding to the late blastula (sphere) stage. The same results were obtained in three independent experiments. d Radial analysis averaged over time-lapse recordings from 13 nuclei.

Acknowledgments
This image is the copyrighted work of the attributed author or publisher, and ZFIN has permission only to display this image to its users. Additional permissions should be obtained from the applicable author or publisher of the image. Full text @ Nat. Commun.