FIGURE SUMMARY
Title

ELAVL1a is an immunocompetent protein that protects zebrafish embryos from bacterial infection

Authors
Ni, S., Zhou, Y., Song, L., Chen, Y., Wang, X., Du, X., Zhang, S.
Source
Full text @ Commun Biol

Identification of ELAVL1a as an LTA-binding protein.

a SDS-PAGE of the proteins isolated from the embryos extracts of zebrafish on LTA-conjugated Sepharose CL-4B affinity resin. Lane M, marker; lane 1, embryos extracts; lane 2, effluent fractions after Tris-HCl wash; lane 3, effluent fractions after throughout elution; lane 4, effluent fractions containing the absorbed proteins; lane 5, effluent fractions from LTA-conjugated Sepharose CL-4B affinity resin with no embryos extracts loaded; lane 6, effluent fractions from Sepharose CL-4B affinity resin with no conjugated LTA. b Domain structure of ELAVL1a predicted by the SMART program. c 3D structures of the ELAVL1a generated by SWISS-MODEL online software using human ELAVL1 (PDB code: 4egl.1.A) as the model. d Western blotting of ELAVL1a in different tissues including heart (H), liver (L), spleen (Sp), gut (Gu), kidney (K), muscle (Mu), skin (Sk), brain (Br), eye (E), gill (Gi), ovary (O), testis (Te) and tail (Ta). e Western blotting of ELAVL1a at the different developmental stages including zygote (0 h), 4-cell stage (about 1 h), 16-cell stage (~1.5 h), 256-cell stage (~2.5 h), high blastula stage (~3.5 h), 50% epiboly stage (~5.5 h), 10-somite stage (~15 h), 2-day post-fertilization (2-dpf), 3-dpf, and 7-dpf. The values of the quantification of Western blotting were given as well. Data are presented as the means ± SD.

Distribution of zebrafish ELAVL1a in the cells of different developmental stage embryos and expression patterns of zebrafish <italic>elavl1a</italic> in the different tissues as well as at the different developmental stages.

a Immunohistochemical localization of ELAVL1a in the different developmental stage: 2-cell stage (about 0.75 h); 8-cell stage (~1.25 h); 16-cell stage (~1.5 h); 256-cell stage (~2.5 h); 50% epiboly stage (~5.3 h); 10-somite stage (~15 h); 24-h post-fertilization (24-hpf); Control: 16-cell embryo incubated with mouse pre-immune serum as control. Scale bars represent 100 μm. b Expression profiles of zebrafish elavl1a in the different tissues including kidney (K), gill (Gi), eye (E), heart (H), skin (Sk), muscle (Mu), spleen (Sp), liver (L), gut (Gu), ovary (O), testis (Te), tail (Ta), and brain (Br). c Expression profiles of zebrafish elavl1a at the different developmental stages including zygote (0 h), 4-cell stage (about 1 h), 16-cell stage (~1.5 h), 256-cell stage (~2.5 h), high blastula stage (~3.5 h), 50% epiboly stage (~5.5 h) embryos, 10-somite stage (~15 h), 2-day post-fertilization (2-dpf), 3-dpf, and 7-dpf larvae. β-actin was chosen as the internal control for normalization. Relative expression data were calculated by the method of 2−∆∆Ct. The vertical bars represent the mean ± SD (n = 3). The data are from three independent experiments performed in triplicate. d Expression of elavl1a during early development detected by WISH. Stages of embryonic development: newly fertilized egg (0 h); 2-cell stage embryo (~0.75 h); high blastula stage embryo (~3.5 h); 50% epiboly stage embryo (~5.3 h); 14-somite larvae (16 h); 1-day-old larvae; 2-day-old larvae; 3-day-old larvae. The color of the positive signal is purple.

Binding of rELAVL1a to Gram-positive and Gram-negative bacteria, LTA, LPS, and lipid A.

a, b Western blotting about interaction of rELAVL1a with Gram-positive (a) and Gram-negative (b) bacteria. Lane M, marker; lane 1, purified rELAVL1a; lane 2, 4 and 6, M. luteus, B. subtilis and S. aureus (a) or E. coli, V. anguillarum and A. hydrophila (b) incubated in the presence of rELAVL1a; lane 3, 5, and 7, M. luteus, B. subtilis and S. aureus (a) or E. coli, V. anguillarum and A. hydrophila (b) incubated in the absence of rELAVL1a. c, d, e Interaction of rELAVL1a with LTA (c), LPS (d), Lipid A (e) revealed by ELISA. f Effects of various sugars on the interaction of rELAVL1a with LPS. g, h Interaction of rELAVL1a with LPS was inhibited by LTA (g) and LPS (h), the final concentration of rELAVL1a was 25 μg/ml. Each point in the graph represents the mean ± S.D. (n = 3). The data are from three independent experiments performed in triplicate. The bars represent the mean ± S.D.

Antibacterial activity of rELAVL1a and its effects on bacterial structures.

a Antibacterial activities of rELAVL1a against Gram-positive bacteria M. luteus and Gram-negative bacteria E. coli and E. tarda. Each point in the graph represents the mean ± S.D. (n = 3). The data are from three independent experiments performed in triplicate. The bars represent the mean ± SD. b The halos showing antibacterial activities of rELAVL1a against representative bacteria, including the Gram-positive bacterium M. luteus and the Gram-negative bacteria E. coli and E. tarda. The halos without the cup (bottom) were shown. c Transmission electron microscopy. Control, M. luteus, B. subtilis, S. aureus, E. coli, V. anguillarum and A. hydrophila incubated with PBS; Experimental, M. luteus, B. subtilis, S. aureus, E. coli, V. anguillarum and A. hydrophila incubated with rELAVL1a. Scale bars represent 500 nm.

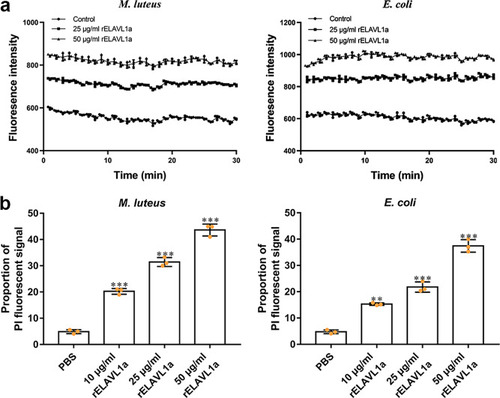
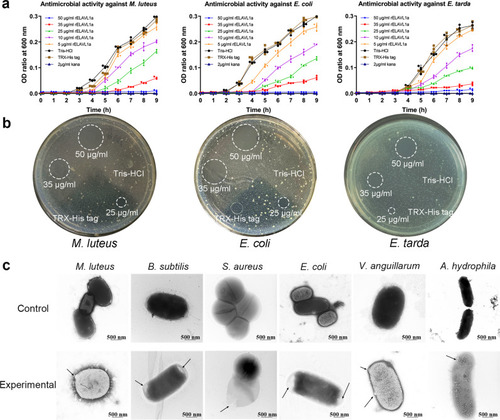
a The rELAVL1a caused depolarization of the bacterial plasma membrane. The changes in fluorescence intensity were recorded with a Tecan GENios plus spectrofluorometer at an excitation wavelength of 622 nm and an emission wavelength of 670 nm. Control, HEPES buffer containing 20 mM glucose. b The effects of rELAVL1a on the membrane integrity of M. luteus and E. coli, cells analyzed by flow cytometry. All data were expressed as mean values ± SD. (n = 3). The data are from three independent experiments performed in triplicate. The bars represent the mean ± S.D. The significance of the difference was determined by one-way ANOVA. **p < 0.01, ***p < 0.001.

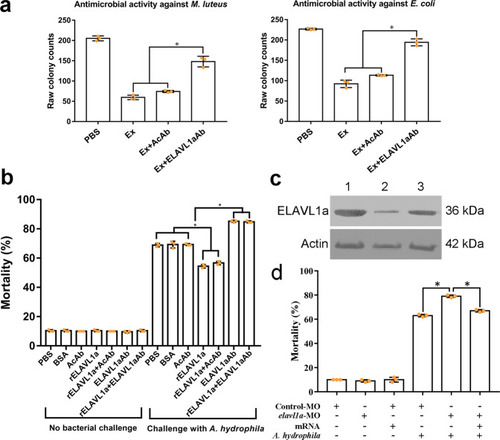
a Antimicrobial activities of the embryo extract against M. luteus and E. coli. b The early (8-cell stage) embryos were first microinjected with PBS, BSA, anti-β-actin antibody (AcAb), anti-ELAVL1a antibody (ELAVL1aAb), rELAVL1a, and rELAVL1a plus AcAb or rELAVL1a plus ELAVL1aAb and then challenged by injection with live A. hydrophila (8.3 × 107 cells/ml). The development of the embryos was observed, and the cumulative mortality rate was calculated at 24 h after bacterial injection. c Western blotting analysis of the efficacy of elavl1a-MO. β-Actin was used as control. Lane 1, 2, 3, the levels of ELAVL1a and β-Actin in the embryos injected with control morpholino (1), elavl1a-MO (2), or co-injection of elavl1a-MO plus elavl1a-mRNA (3). d The reduced antibacterial activity of the elavl1a-MO-knockdown embryos. The 24-h mortality of elavl1a-MO-knockdown group, control group, and rescued group, after the challenge with live A. hydrophila (8.3 × 107 cells/ml). All data were expressed as mean values ± S.D. (n = 3). The data are from three independent experiments performed in triplicate. The bars represent the mean ± SD. The significance of the difference was determined by one-way ANOVA. *p < 0.05. M, marker; con, control; Ex, embryo extract; AcAb, anti-β-actin antibody; ELAVL1aAb, mouse anti-ELAVL1a antibody.

Diagram showing zebrafish ELAVL1a truncation and their antibacterial activities and binding to LPS and LTA.

a Diagram showing zebrafish ELAVL1a truncation. b Antibacterial activity of rE181–242 against M. luteus and E. coli. c, d, e Interaction of rE181–242 (c), rE1–180 (d) and rE243–324 (e) with LTA and LPS revealed by ELISA. f The in vivo bioactivity of rE1–180, rE181–242, and rE243–324. The early (8-cell stage) embryos were first microinjected with PBS, BSA, anti-β-actin antibody (AcAb), anti ELAVL1a antibody (ELAVL1aAb), rE1–180, rE181–242, rE243–324 and rELAVL1a, then challenged by injection with live A. hydrophila. The development of the embryos was observed and the cumulative mortality rate was calculated at 24 h after injection. All data were expressed as mean values ± S.D. (n = 3). The data are from three independent experiments performed in triplicate. The bars represent the mean ± SD. The significance of the difference was determined by one-way ANOVA. *p < 0.05. AcAb, anti-β-actin antibody; ELAVL1aAb, mouse anti-ELAVL1a antibody.

Antibacterial activity of rE<sub>181–242</sub> mutants.

a Diagram showing the site-directed mutagenesis. b SDS-PAGE of the mutants, showing that they all have a similar molecular mass. c Antibacterial activities of rE181–242 mutants against M. luteus and E. coli. rE181–242 was used as positive control and Tris-HCl buffer used as negative control. d Interaction of E1–180 mutants with LTA and LPS revealed by ELISA. Each point in the graph represents the mean ± SD (n = 3). The data are from three independent experiments performed in triplicate. The bars represent the mean ± SD.

Acknowledgments
This image is the copyrighted work of the attributed author or publisher, and ZFIN has permission only to display this image to its users. Additional permissions should be obtained from the applicable author or publisher of the image. Full text @ Commun Biol